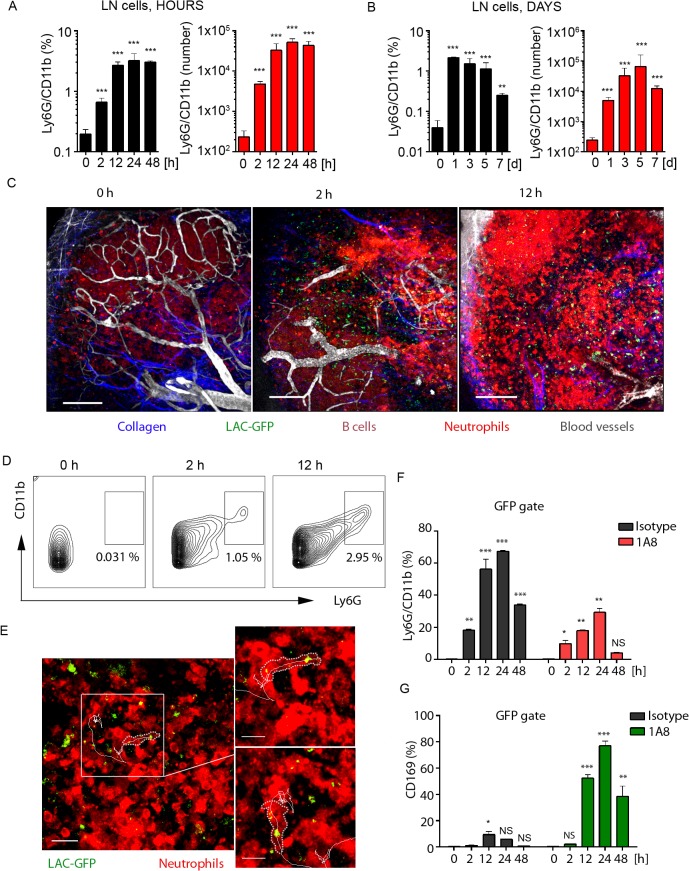
Fig 3. Local LAC-GFP infection recruits neutrophils to the iLN.
C57BL/6 or dsRed BM chimeric mice were injected subcutaneously near the iLN with LAC-GFP in amount of 1 x 10⁵ CFU per iLN or given PBS as a control. Neutrophil recruitment to the iLN was analyzed by flow cytometry between 0 and 48 h. PBS injected control is shown as a time point 0 of infection. DsRed chimeric mice were imaged using TP-LSM between 2 and 12 h after infection. (A) Kinetics of neutrophil mobilization to the iLN between 0 and 48 h after infection is shown. (B) Kinetics of neutrophil mobilization to the iLN between days 0 and 7 after infection is shown. (A, B) Percentages of Ly6Ghi/CD11bhi population (left) and total Ly6Ghi/CD11bhi cell numbers per iLN (right) in live cell gate are shown. N = 4 mice/8 iLNs. Means ± SD. (C) TP-LSM images of neutrophil accumulation (dsRedhi, bright red) in iLN at 0 h (left), 2 h (middle), and 12 h (right) after LAC-GFP (green) injection are shown (S7 Movie). Blood vessels (EB, gray); collagen (second harmonic, blue). IFZ (IF), LN follicle (B, dotted line), and LN borders (dashed line) are labeled. Scale bars: 50 μm. (D) At indicated time points, representative flow cytometry plots show Ly6Ghi/CD11bhi cell population in the iLN of infected dsRed mice. Data is representative of 4 iLNs. (E) 2 min migration route of a single neutrophil (red) loaded with LAC-GFP bacteria (green) is shown. IFZ, 6 h after infection (S8 Movie). Enlarged images of the same cell at time points 1 and 100 sec are shown to the right. Neutrophil cell border is outlined with dotted line; cell track is shown with solid line. Scale bars: 20 μm (left), 5 μm (right). Data is representative of 4 imaging sessions. (F, G) Infected and control mice were injected with isotype control or 1A8 antibody at 100 μg/mouse on day -1 and 0 of infection and LN cells were analyzed for GFP signal using flow cytometry. Analysis of LAC-GFP uptake by (F) Ly6Ghi/CD11bhi and (G) CD169+ populations in the iLN of isotype control or 1A8 injected mice between 0 and 48 h after infection is shown. N = 4 mice/8 iLNs. Means ± SD.

