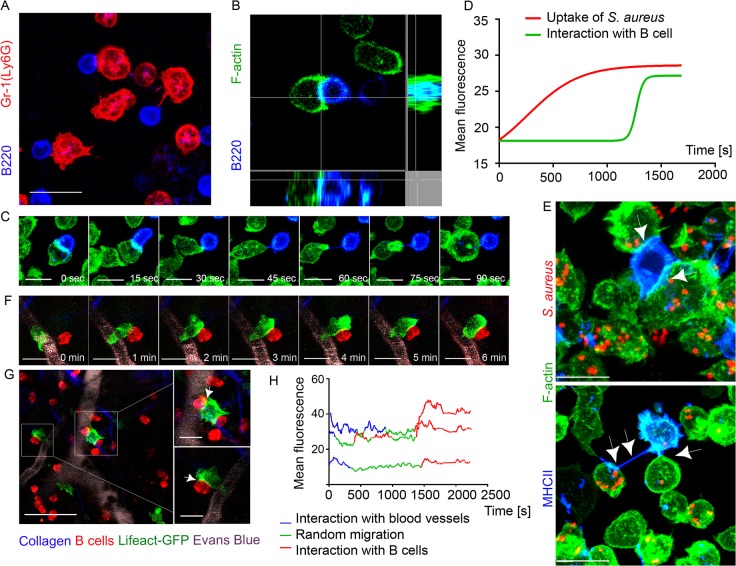
Fig 4. F-actin accumulates at interaction sites between neutrophils and B cells.
Lifeact-GFP neutrophils and B cells were co-cultured on ICAM-1+VCAM-1+KC coated surface and imaged using confocal microscopy. Lifeact-GFP neutrophils and dsRed B cells were adoptively transferred into C57BL/6 mice 24 h prior to imaging. Mice were injected subcutaneously with S. aureus bioparticles near the iLNs, and imaged using TP-LSM 12 h after immunization. (A) A live-cell confocal image of BM derived neutrophils (Ly6G, red) and LN derived B cells (B220, blue) co-cultured for 2 h. Scale bar: 10 μm. (B) Single-plane confocal image of F-actin at a cell-cell contact between a neutrophil (Lifeact-GFP, green) and a B cell (B220, blue). (C) Time-lapse series of images shows F-actin clustering at the leading edge of a neutrophil interacting with a B cell. Scale bars: 7 μm. (D) Comparison of F-actin assembly during S. aureus phagocytosis by neutrophils and during neutrophil-B cell interactions measured as increase in the GFP fluorescence intensity (S9 Movie). 25 cells analyzed, curves averaged and fitted using GraphPad Prism software. (E) Live-cell confocal images of F-actin enriched tight cell-cell contacts (upper image, arrowheads) and nanotubes (lower image, arrowheads) formed between neutrophils (Lifeact-GFP, green) and B cells (MHCII, blue) co-cultured for 2 h, and with S. aureus bioparticles added to the co-cultures. Scale bars: 7 μm. (F) Time-lapse series of TP-LSM images showing steps of short-term interaction between a Lifeact-GFP neutrophil (green) and a B cell (red) in perivascular space in vivo. Scale bars: 7 μm. (G) Lifeact-GFP neutrophils (green) encountering B cells (red) near blood vessels (EB, gray); scale bar: 25 μm. Enlarged images (squares to the right); scale bars: 10 μm. (H) F-actin clustering in neutrophils during their egress from the blood vessels, random migration, and interaction with B-cells measured as GFP mean fluorescence intensity. The fluorescence fluctuation in 3 cells is shown; 25 cells analyzed.

