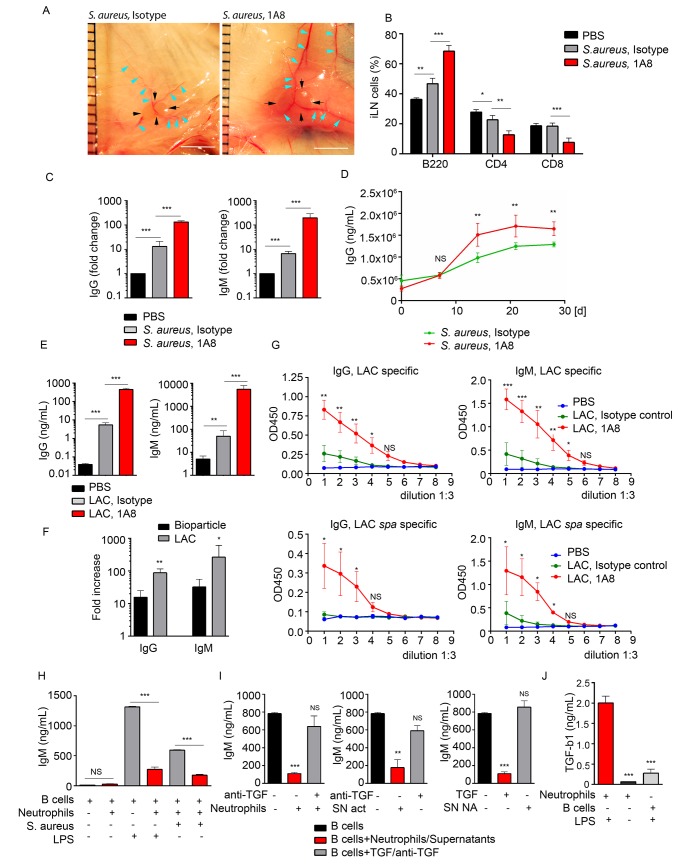
Fig 5. Neutrophils limit the humoral response following local immunization or infection.
C57BL/6 mice were given PBS as a baseline control, immunized with S. aureus bioparticles, or infected with LAC-GFP. Isotype control or 1A8 antibody was injected intraperitoneally at 100 μg/mouse on day -1, 0 and 1 of immunization/infection. (A) Images of iLNs in isotype control (left) and neutrophil depleted (right) mice immunized with S. aureus bioparticles are shown at day 5 after immunization. Indicated are LN edges (black arrows), blood vessels (blue arrows). Scale bars: 5 mm. (B) Flow cytometry analysis of B and T cell populations in the iLN of isotype control or neutrophil-depleted mice 3 days after immunization. N = 4 iLNs; 3 repeats. Means ± SEM. (C) ELISA of total IgG and IgM produced by iLN B cells isolated from PBS control, immunized isotype control and immunized neutrophil-depleted (1A8) mice. B cells were isolated from the iLNs at day 6 after immunization and cultured for 3 days. N = 4 iLNs. Data are shown as fold change. 3 repeats. Means ± SEM. (D) ELISA of total IgG in the serum of immunized isotype control and immunized neutrophil-depleted mice measured at days 0, 7, 14, 21 and 28 after immunization. N = 4 mice; 2 repeats; means ± SEM. (E-G) Mice were depleted of neutrophils as above and infected with LAC-GFP. (E) ELISA of total IgG and IgM produced by iLN B cells. ILNs were harvested at day 5 after infection, B cells were isolated and cultured for 3 days. N = 5–7 iLNs. Data are shown as antibody concentration in B cell supernatants. Means ± SD. (F) Comparison of fold changes in IgG and IgM production in neutrophil-depleted and isotype iLNs, calculated for S. aureus immunized versus LAC-GFP infected mice. Data shown as fold increases (Means ± SD). (G) ELISA of LAC-specific (upper panel) and LAC spa-specific IgG and IgM. N = 5–7 iLNs. Means ± SD. (H) ELISA of IgM produced in vitro by LPS or S. aureus activated LN B cells in presence of neutrophils, activated correspondingly. No LPS in culture used as a baseline control. (I) ELISA of IgM produced by LPS activated iLN B cells in presence of LPS-activated neutrophils supernatants from LPS-activated (SN act) and non-activated neutrophils (SN NA), neutralizing anti-TGF-β1 antibody, and TGF-β1. (J) ELISA results measuring TGF-β1 produced by activated neutrophils, non-activated neutrophils or LPS-activated B cells in 24 h cultures. (H-J) Final concentration of LPS in all B cell cultures: 2 μg/mL. 3 to 5 repeats for each of in vitro experiments. Means ± SEM.

