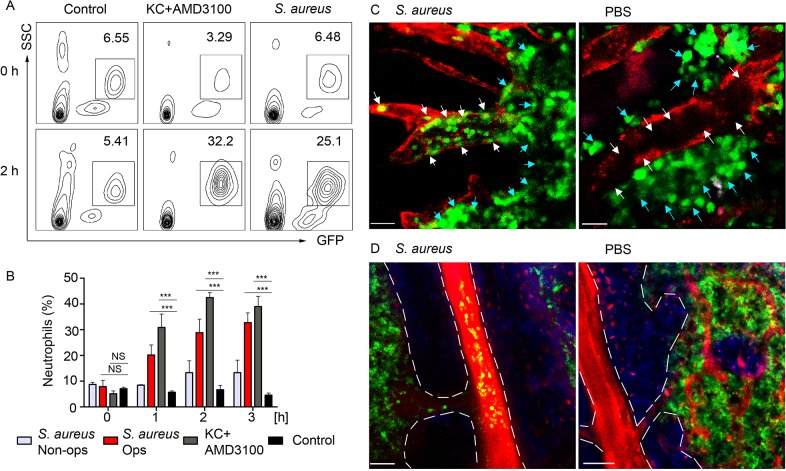
Fig 7. BM neutrophils are mobilized to the blood stream after local immunization.
LysM-GFP mice were injected with S. aureus bioparticles near the iLN. Neutrophil mobilization was analyzed using flow cytometry of the whole blood or TP-LSM of the calvarium bone marrow. Anti VE-cadherin antibody or EB were injected intravenously to outline the blood vessels. (A) Flow cytometry plots of GFPhi cells in the blood of mice injected subcutaneously with PBS, intravenously with KC+AMD3100, or subcutaneously with S. aureus are shown. Results are from 0–2 h after injection and representative of 3 independent experiments. (B) Kinetics of neutrophil recruitment in mice injected with opsonized (Ops) or non-opsonized (Non-ops) S. aureus versus KC+AMD3100 between 0 and 3 h. Data are from flow cytometry analysis of whole blood. N = 3; repeated 3 times. Means ± SEM. (C) TP-LSM images of calvarium capillaries (Alexa Fluor 660-conjugated anti-VE-cadherin, red) at 2 h after immunization (left) or PBS injection (right). GFPhi cells (green) within the niche (blue arrows) and within the blood vessels (white arrows) are indicated. Scale bars: 30 μm. (D) Images of the central vein in S. aureus (left) and PBS (right) injected mice 3 h later (S1 Movie). Central vein and vascular niche (EB, red) borders are shown with dashed lines. Scale bars: 50 μm. Images are representative of 5 imaging sessions.

