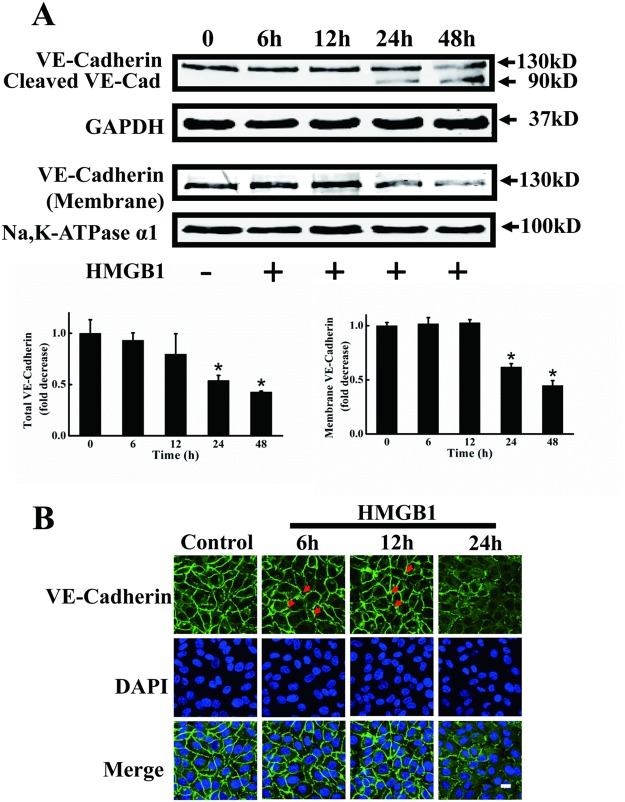
Fig 2. Disruption of VE-cadherin and intercellular gap formation in HMGB1-treated EA.hy926 cells.
A. Representative immunoblots showing reduced expression of VE-cadherin protein by HMGB1. Total and cell membrane VE-cadherin protein levels were measured by western blotting in EA.hy926 cells treated with HMGB1 for 6, 12, 24 and 48 h, respectively. GAPDH and Na,K-ATPase α1 were used as loading controls for intact cells and plasma membranes, respectively. Western blots were quantified and analyzed statistically based on three independent experiments. *Indicates significant difference compared with wild-type group (P<0.05). B. HMGB1 increased intercellular gap formation. EA.hy926 cells were plated onto a Petri dish until the formation of a tight monolayer then treated with 200 ng/ml HMGB1 for 6, 12 and 24 h, respectively. The cells were fixed and distribution of VE-cadherin was detected using rabbit anti-human VE-cadherin antibody and FITC-labeled goat anti-rabbit antibody. Nuclei were stained with DAPI. Red arrows indicate intercellular gaps. A merged picture is shown for each condition. A representative field for each condition was captured using an Olympus FV1000 confocal microscope. Scale bar = 10 μm.

