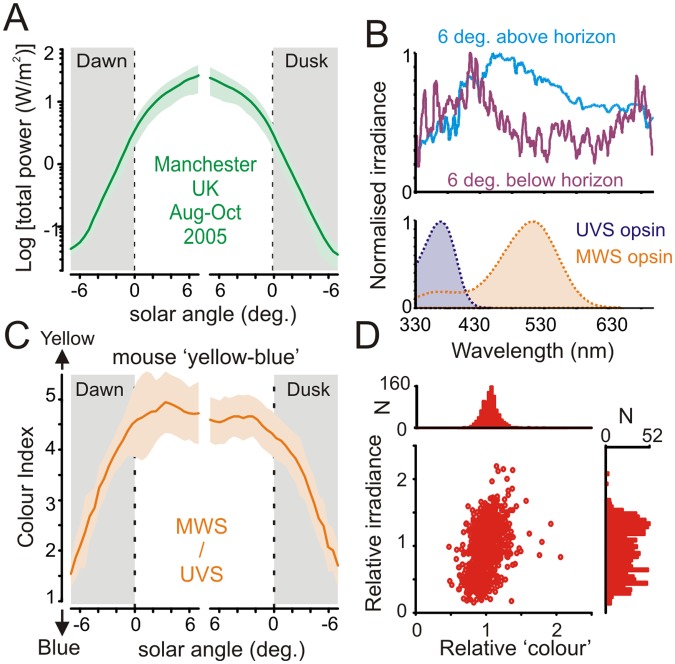
Fig 1. Spectral composition of ambient illumination is predictive of solar angle.
(A) Mean (±SD) total optical power of ambient illumination around dawn/dusk as a function of solar angle relative to horizon (n = 36 d, Aug–Sep 2005; Lat.: 53.47, Long.: -2.23, Elevation 76 m). (B, top) Normalised mean spectral power distribution observed at solar angles ±6° relative to horizon. Note relative enrichment of short-wavelength light at negative solar angles. Bottom panel shows mouse ultraviolet and medium wavelength sensitive (UVS and MWS) cone opsin sensitivity profiles after correction for prereceptoral filtering. (C) Mean (±SD) “yellow–blue” colour index (effective activation of MWS/UVS opsin) as a function of solar angle around dawn/dusk. (D) Relationship between colour and irradiance (see Methods for definition), corrected according to mean for each solar angle (n = 994; -7 to 0° in 0.5° bins × 71 dawn/dusk observations; for clarity, six observations with especially high relative brightness (2.6–4.5) but normal colour (1.3–1.5) are not shown in the scatter plot). Note tighter distribution for relative “colour” versus irradiance. The data used to make this figure can be found in S1 Data.

