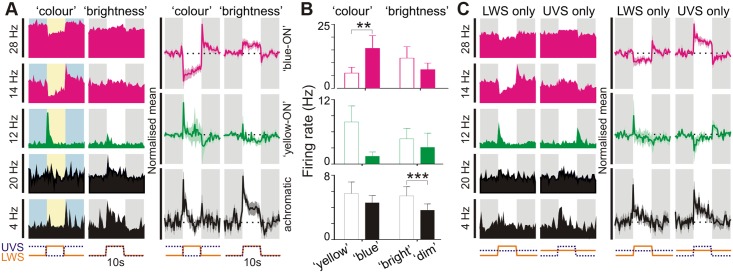
Fig 2. Colour opponent responses in suprachiasmatic neurons.
(A: left) Example responses of 5 SCN neurons to stimuli modulating UVS and LWS opsin excitation in antiphase (“colour”) or in unison (“brightness”; both 70% Michelson contrast). Individual cells were preferentially excited by blue–yellow transitions (“blue ON”; pink traces), yellow-blue transitions (“yellow ON”; green traces) or dim-bright transitions (“achromatic”; black traces). Shaded areas represent blue/yellow or dim/bright stimulus phase; y-axis scale bars reflects peak firing rate in spikes/s; x-axis scale bars indicate temporal profile of UVS/LWS opsin excitation. (A: right) Normalised mean (±SEM) change in firing for cells classified as “blue-ON”, “yellow-ON” or achromatic (n = 13, 4 and 26 respectively). Conventions as above. (B) Mean (±SEM) firing rates of SCN cell populations tested with colour and brightness stimuli immediately following transitions (0–500 ms) from “blue”–”yellow”/”dim”–”bright” or vice versa. Data were analysed by paired t test; *** p<0.001, ** p<0.01. (C: left) Responses of cells from A to selective modulation of LWS or UVS opsin excitation, indicating “blue”-ON/”yellow-OFF”, “yellow-ON”/”blue-OFF” or non-opponent responses (conventions as in A). (C: right) Normalised mean (±SEM) change in firing for SCN cell populations evoked by LWS and UVS opsin isolating stimuli. Note, normalisation and scaling for data in A and C is identical. The data used to make this figure can be found in S2 Data.

