
Fig 4. Colour-signals control irradiance coding in suprachiasmatic neurons.
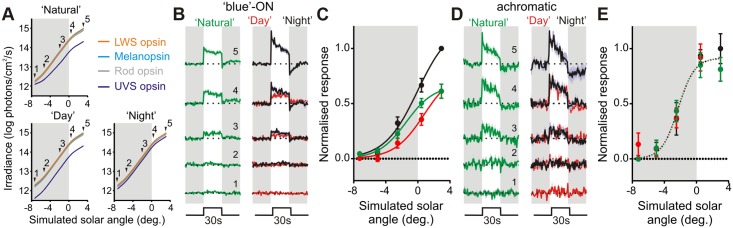
(A) Stimuli used to examine twilight coding: top panel indicates natural change in effective photon flux for each mouse opsin as a function of solar angle (0° represents sunrise/sunset), indicated points were recreated using a three-primary LED system. Note: values for LWS opsin stimulation were chosen to replicate those calculated for the wild-type MWS opsin under natural conditions. Bottom panels indicate control stimuli, which replicated the “natural” change in irradiance but lacked changes in colour (UVS opsin excitation held at a constant ratio relative to LWS, to mimic “day” or “night” spectra). (B) Mean (±SEM) normalised responses of blue-ON cells (n = 9) to 30-s light steps recreating the indicated stages of twilight. Responses were normalised on a within-cell basis according to the largest response observed across all three stimulus sets. (C) Initial (0–10 s) responses of cells from B as a function of simulated solar angle, fit with four-parameter sigmoid curves. Note influence of twilight spectral composition on the solar angle response curve (F-test for difference in curve parameters; p = 0.009; direct comparisons between each pair of curves also revealed significant differences p<0.05). (D and E) Responses of achromatic cells (n = 8), conventions as in B and C. Achromatic cell responses to the three stimulus sets were statistically indistinguishable (F-test; p = 0.72). The data used to make this figure can be found in S4 Data.