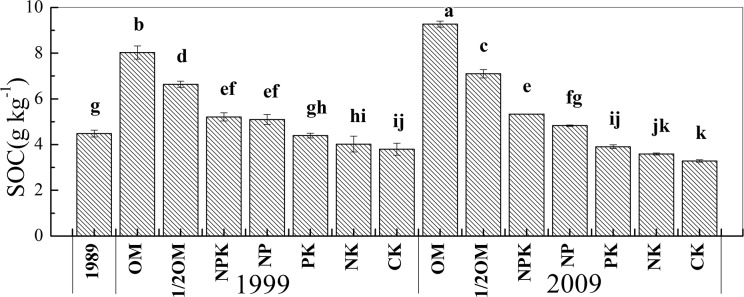
Fig 1. Soil organic carbon (SOC) content as affected by fertilization treatment and time.

Treatments followed by different letters are significantly different at p < 0.05 (Tukey test, n = 3).

Treatments followed by different letters are significantly different at p < 0.05 (Tukey test, n = 3).