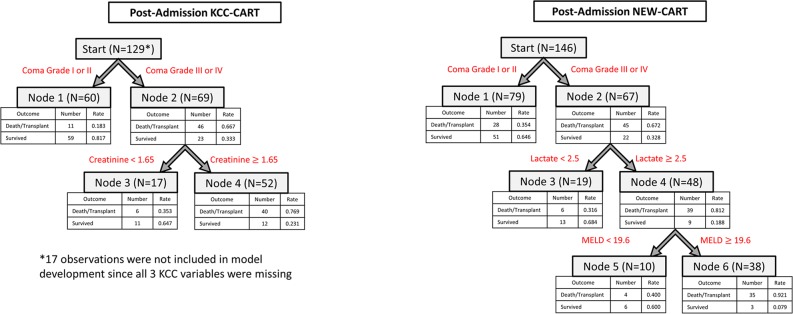
Fig 3. Post-Admission CART Models.

The post-admission KCC-CART (left panel) has two decision rules and consists of four total nodes. Each node provides the total number of subjects within the node, as well as the number of survivors and dead/LT patients with the respective rates. Node 4 represents high risk of dead/LT outcome, and nodes 1 and 3 are low risk of dead/LT outcome. To calculate performance measures for the model, all subjects in node 4 were predicted as dead/LT outcomes, and all subjects in nodes 1 and 3 were predicted as spontaneous survivors. The post-admission NEW-CART (right panel) has three decision rules and consists of six total nodes. Node 6 patients were considered high risk for dead/LT outcome and were predicted as such, whereas nodes 1, 3 and 5 were predicted as survivors.
