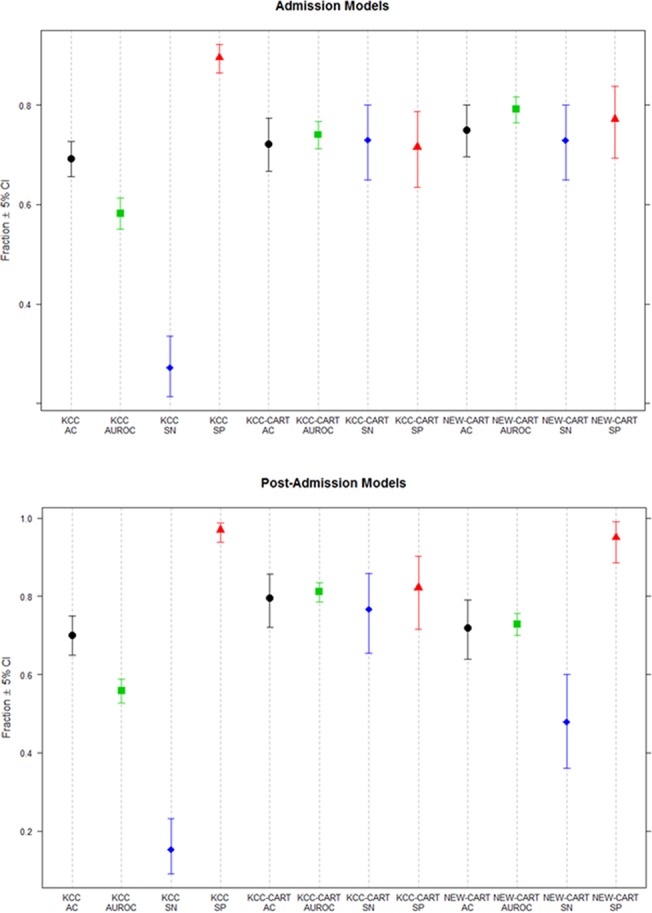
Fig 4. Plots of Confidence Intervals of Accuracy, AUROC, Sensitivity and Specificity for Admission and Post-Admission Models.

Plots display confidence intervals for accuracy (AC), area under the receiver operating curve (AUROC), sensitivity (SN) and specificity (SP) from Table 2. The admission plot (top panel) illustrates non-overlapping, higher confidence intervals for both KCC-CART and NEW-CART compared to KCC for AUROC and sensitivity, and lower confidence intervals for specificity. This indicates that the CART models had significantly better AUROC and sensitivity than KCC, but had significantly worse specificity compared to KCC. Confidence intervals for accuracy for KCC, KCC-CART and NEW-CART all overlap, indicating no significant differences between the models. The post-admission plot (bottom panel) again indicated no significant differences between the models in terms of accuracy; however, the AUROC and sensitivity of KCC-CART was significantly higher than that of NEW-CART and KCC. The specificity of KCC was highest, but did no differ significantly from that of the NEW-CART. KCC demonstrated significantly higher specificity than the KCC-CART, but the difference was not significant compared to the NEW-CART.
