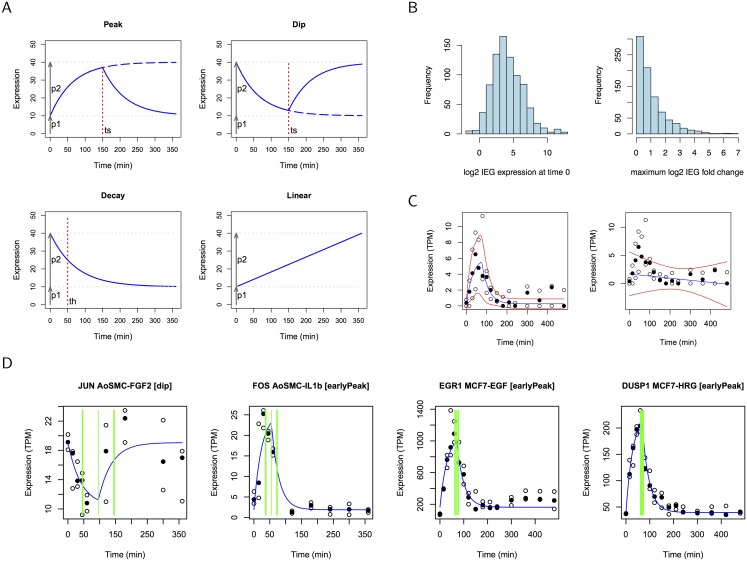
Fig 1. Kinetic signatures for IEGs.
(A) Kinetic signatures are defined as piece-wise exponential (peak and dip), simple exponential (decay) or linear functions.(B) CAGE clusters associated with known IEGs show significant expression at time 0 (left; median 14.7 TPM). The maximum log2 fold change at any point in the time course over expression at time 0 is typically less than 2 (right; median 1.64). Histograms show data from all four data sets for 194l known IEGs. (C) Kinetic signatures fitted to the CAGE time course of EGR1 in EGF treated MCF7 cells yield values for the fit (log Z) and estimates for parameter moments. Plots show the kinetic signature function using computed parameter means (blue) and confidence intervals (red) for peak (left) and linear (right) kinetic signatures. In this case, log Z for the peak signature (-27.2) is greater than that for the linear model (-35), indicating a significantly better explanation of the data. Data values are plotted as circles (median value is filled). (D) CAGE time course data and best-fitting kinetic signature for IEGs JUN, FOS, EGR1 and DUSP1 (colours as in (C)). The vertical green lines indicate the mean switch time t S and one standard deviation above and below.

