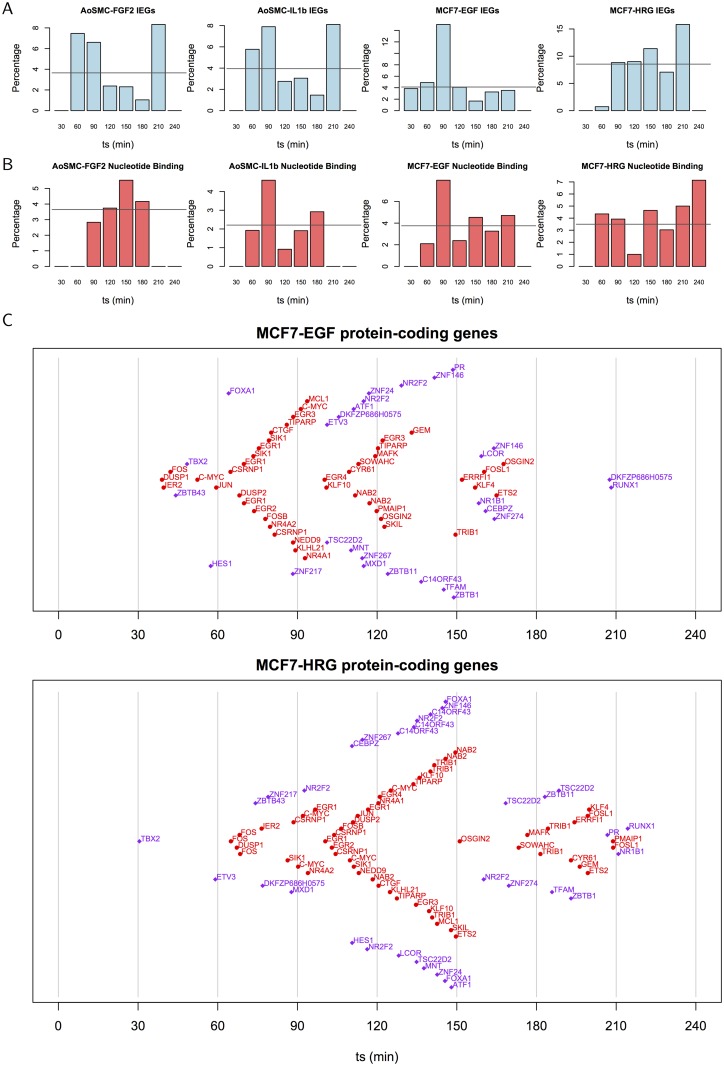
Fig 2. Timing of early peak CAGE clusters.
(A) Bar charts showing the percentage of early peak clusters associated with IEGs (t s binned in 30 min intervals), and (B) and those associated with nucleotide binding genes. The horizontal line indicates the average percentage. (C) The timing of known IEGs and transcription factors is shown for IEGs (red) and TFs (purple) assigned to the early peak signature in each MCF7 experiment. Symbols indicate the t s (plotted on the x axis) and are labelled with the gene name associated with the CAGE cluster (symbols are positioned on the y axis for legibility only).

