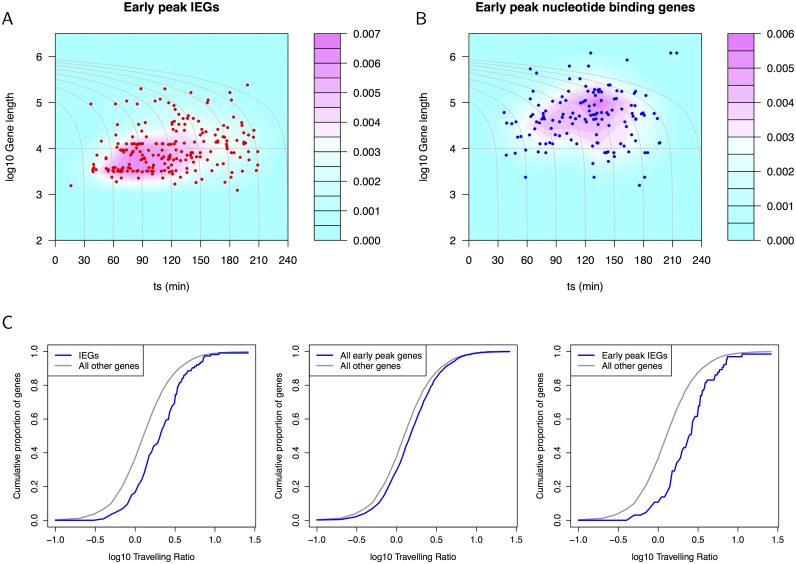
Fig 3. Density plots of gene length against t s for early peak clusters.
Grey contour lines indicate the projected t s for the completion of transcription accounting for gene length (a transcription rate of 60 bases/s is assumed [32]). (A) Early peak known IEGs (red symbols represent the underlying IEG CAGE cluster data). (B) Early peak known nucleotide binding genes and underlying data (blue symbols). (C) Travelling ratios for known IEGs and for early peak genes in MCF7 cells demonstrate promoter proximal pausing as the travelling ratio is shifts towards higher values. The intersection of IEGs and early peak genes (right-most plot) shows that the strong pausing effect seen for IEGs holds for those assigned the early peak signature.

