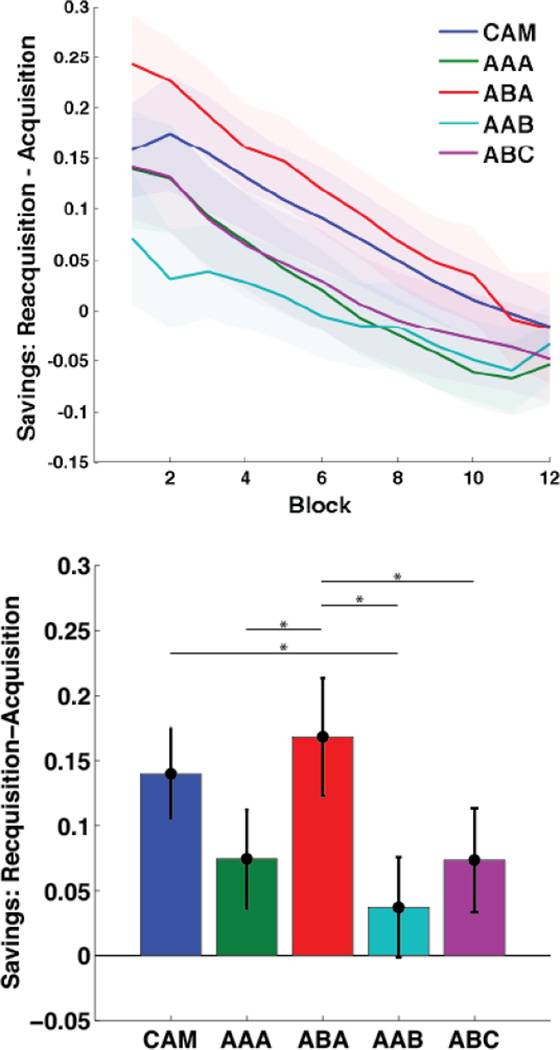
Figure 5.
Savings estimates. Top) Savings (Reacquisition - Acquisition) across blocks, smoothed with a 10 trial moving rectangular window. Each block includes 25 trials, and bands represent SEM. Bottom) Savings pooled across the first 6 blocks of acquisition and reacquisition. Error bars represent 95% confidence intervals.

