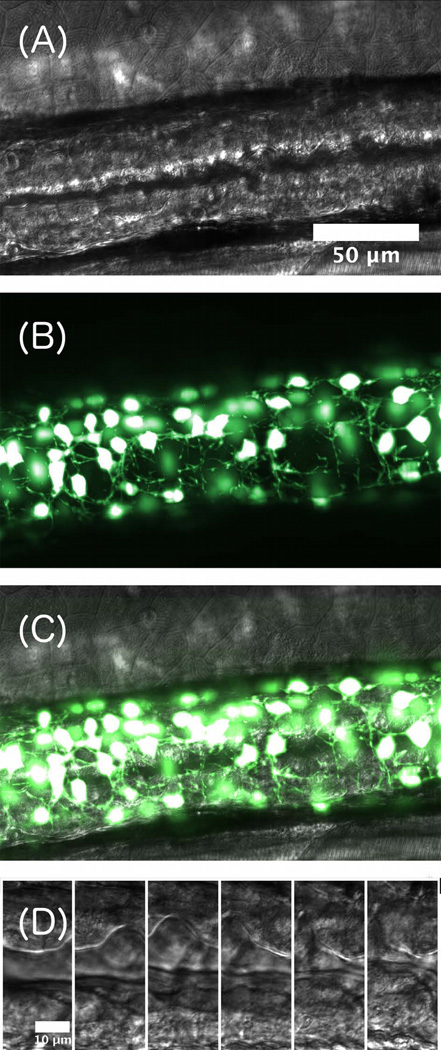
Figure 5.
(A) DICM image of a 5 dpf larval zebrafish gut. (B) False-color maximum intensity projection of a three dimensional LSFM image of enteric neurons. (C) Overlay of the DICM and LSFM images. Image contrast has been enhanced for clarity. (D) A time series of DICM images, separated by 1 second, showing a peristaltic wave of gut motion. Scale bar: 10 microns.

