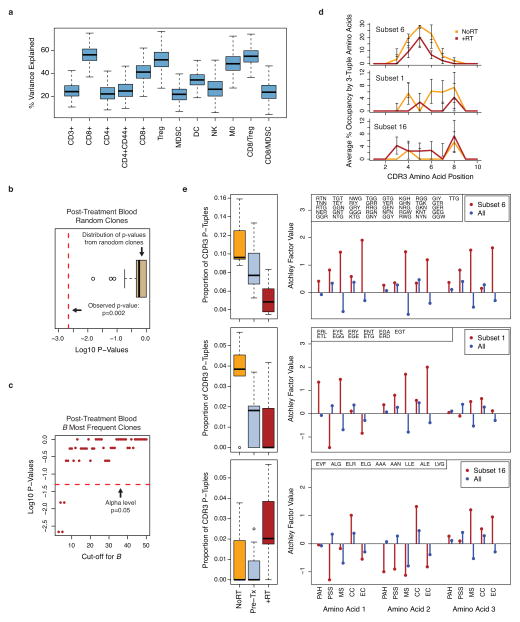
Extended Data Figure 4. TCR clonotypes associated with RT are not observed in random clones from post-treatment blood and have distinct CDR3 features.
a) Boxplot of the bootstrap variance explained by multivariable RF regression model for effect of RT, anti-CTLA4, and/or anti-PD-L1 on immune variables from TILs. b) K-means clustering (k=2) was used on the average CDR3 amino acid features of randomly sampled clones from post-treatment blood after anti-CTLA4, anti-PD-L1, and/or RT. Membership into each cluster was determined and the p-value for separation into treatment groups with and without RT was calculated. Boxplot shows log10 p-values from 1000 random iterations. Comparison to the p-value from the observed data (red dotted line) gives a simulated p < 0.001. c) Log10 p-values for separation into treatment groups with and without RT vs. cut-off value used to select the most frequent clones. The 0.05 significance level is indicated (red dotted line). d) Average % occupancy in the CDR3 of the most frequent T cell clonotypes after RT +/− checkpoint blockade (+RT, red line) or checkpoint blockade alone (NoRT, orange line) by contiguous short amino acid sequences of length three (3-tuples) belonging to e) subsets with distinct treatment-related amino acid properties. These properties are characterized by Atchley factors, which measure 1) PAH: accessibility, polarity, and hydrophobicity, 2) PSS: propensity for secondary structure, 3) MS: molecular size, 4) CC: codon composition, and 5) EC: electrostatic charge. Shown (right) are the average values of each Atchley factor for amino acids that comprise the 3-tuples from the indicated subset (red) compared to all unselected 3-tuples (blue). Boxplots (left) show the proportion of 3-tuples from each of these subsets that are found in the CDR3s of the five most frequent clones after treatment. Compared to pre-treatment samples (Pre-tx), subset 6 is associated with RT +/− checkpoint blockade (+RT) or checkpoint blockade alone (NoRT). Subset 1 is primarily associated with checkpoint blockade alone, and subset 16 is primarily associated with RT +/− checkpoint blockade.

