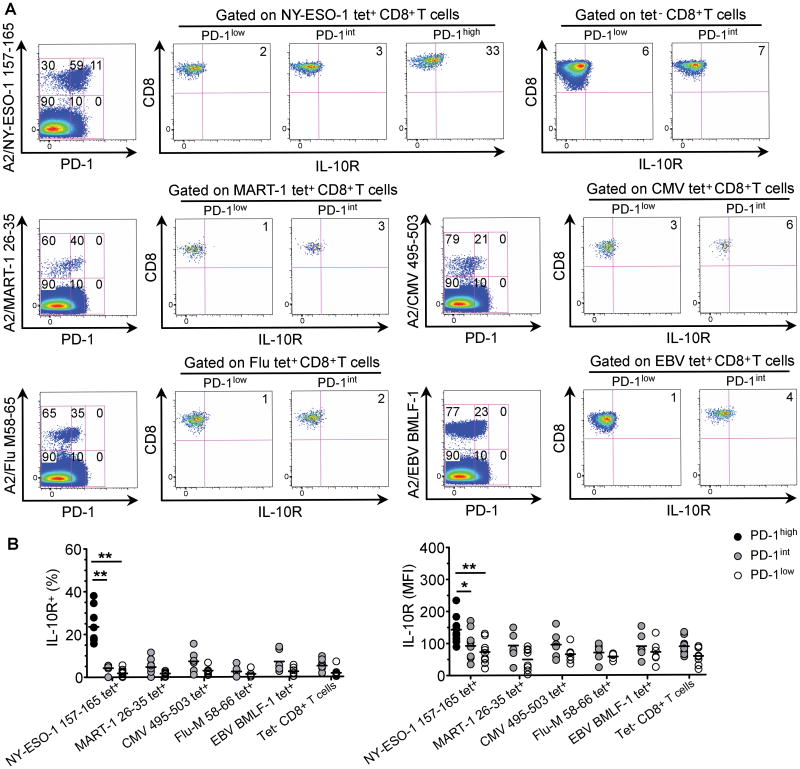
Figure 1.
IL-10R is upregulated by PD-1high NY-ESO-1–specific CD8+ T cells. A and B, Dot plots from one representative patient (A) and summary data for all nine patients with advanced melanoma (B) showing ex vivo IL-10R expression by PD-1high and/or, PD-1int and PD-1low subsets of A2/NY-ESO-1 157–165, A2/MART-1 26–35, A2/CMV 495-503, A2/Flu-M 58–66, A2/EBV BMLF1 280–288 tet+ and total tet- CD8+ T cells. * P < 0.05 and ** P < 0.01. Horizontal bars depict the mean percentage or MFI of IL-10R expression. Data shown are representative of two independent experiments performed in duplicate.

