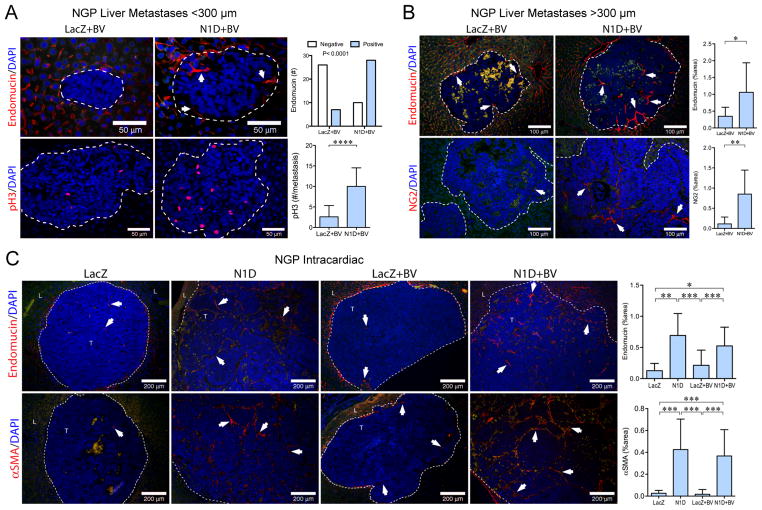
Figure 4. Notch inhibition increases vascularity of liver metastases.
(A) Top panel: small liver metastases (<300μm) immunostained for endomucin. Arrows indicate vascular sprouts. Liver metastases with endomucin(+) sprouts were counted, P<0.0001, Fisher’s exact test. Bar, 50μm. Bottom panel: Proliferation determined by phosphorylated histone H3 (pH3). Mean±stddev. ****P<0.0001. (B) Large metastases (>300 μm) immunostained for endomucin (top panel) and NG2 (bottom panel). Green autofluorescence distinguishes RBC within metastases. Mean±stddev. *P<0.05; **P<0.01. Bar, 100μm. (C) Liver metastases from the NGP intracardiac experiment were immunostained for endomucin (top panel), and αSMA (bottom panel). Mean±stddev. *P<0.05; **P<0.01; ***P<0.001. Bar, 200μm. Nuclei shown by DAPI. Dashed line outlines metastases.

