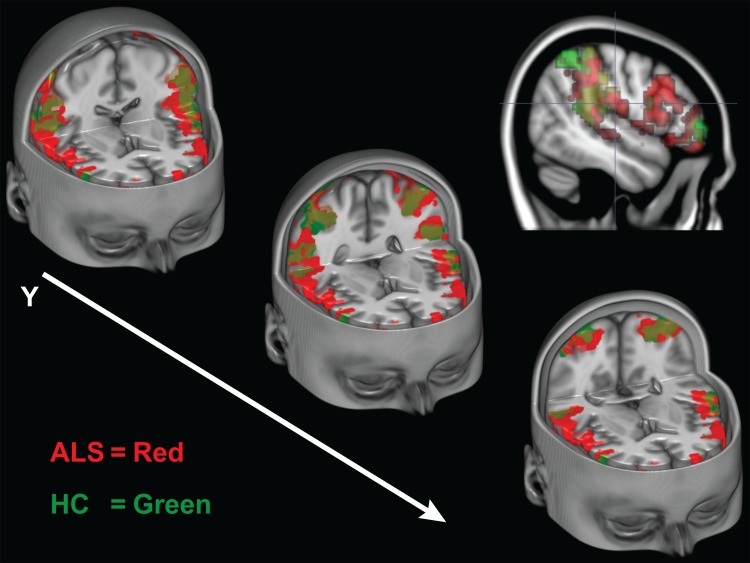
Fig 5. Experiment 1 Conjunction Analysis of Co-activated Voxels During Execution and Observation of Actions.
Cut-out sections of the inferior frontal gyri and inferior parietal lobes. Activity maps indicate only the voxels that were active during both the action execution and observation conditions during Experiment 1. The ALS group’s intersecting voxels are shown in red, the HC group is shown is green. Colors are blended in overlapping regions.)

