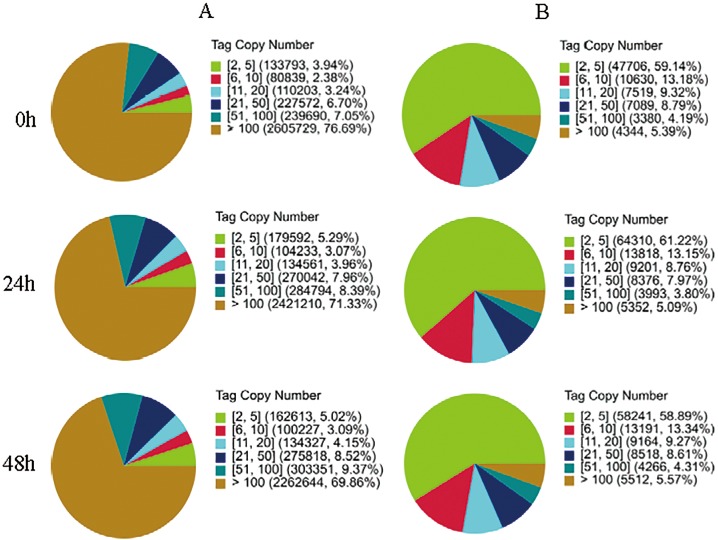
Fig 1. Distribution of total clean tags and distinct clean tags in each sample.
The numbers in square brackets indicate the range of copy numbers of each tag category. The data in parentheses indicate the percentage of corresponding tags among the total clean tags and distinct clean tags. (A) Distribution of total clean tags. (B) Distribution of distinct clean tags.

