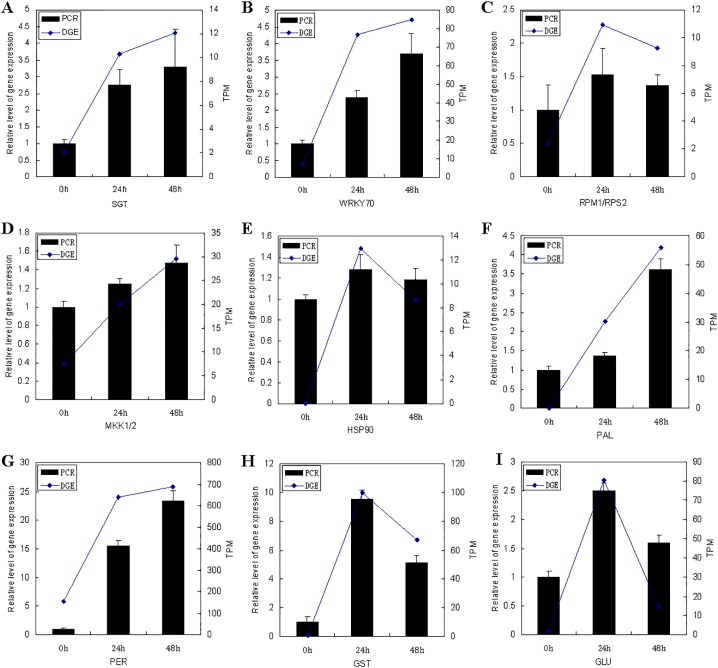
Fig 6. Quantitative RT-PCR validation of DGE analysis.
TPM, transcription per million mapped reads. Relative quantification was carried out to measure changes in target gene expression in foxtail millet leaf samples relative to an endogenous reference gene; 18S rRNA was used as a reference gene. The X axis indicates the inoculation time. The Y axis indicates the fold change of target gene in qRT-PCR and TPM in DGE analysis. Bars represent standard errors of the means.

