
Fig 5. Effects of HFD on mouse testicular morphology and BTB integrity.
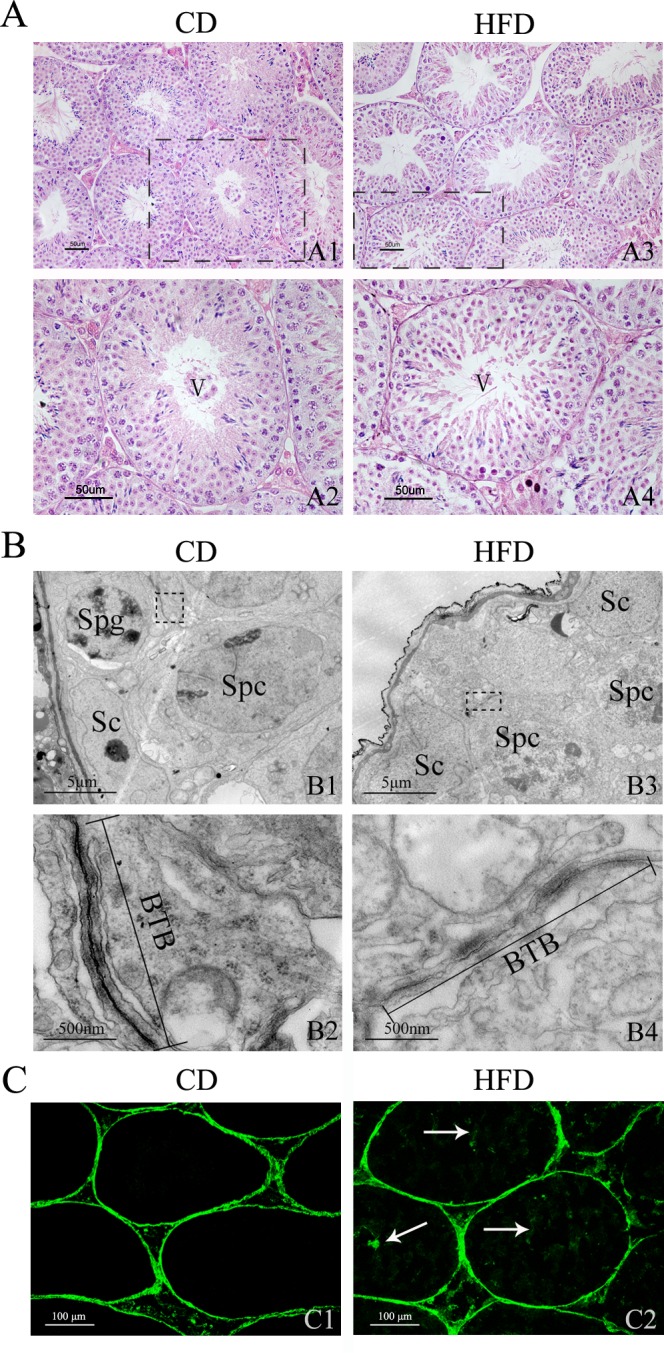
Hematoxylin and eosin-stained testicular sections from mice fed CD (A1) and HFD (A3). Scale bars = 50 μm. (A2), (A4) Enlarged views of indicated sections in (A1) and (A3); the sections of seminiferous tubules are both in spermatogenic stage V. Scale bars = 50 μm. (B) Transmission electron micrograph of seminiferous epithelium of mice fed CD (B1) and HFD (B3). Sc, Sertoli cell; Spg, spermatogonium; Spc, primary spermatocyte. Scale bars = 5 μm. (B2), (B4) Magnified views of indicated sections in (B1) and (B3). Straight lines show BTB between two adjacent Sertoli cells constituted by cellular tight junctions. Scale bars = 500 nm. (C1) In the sections of testes from CD mice, the FITC green fluorescence is only observed in the interstitial spaces and basal compartment. (C2) In the sections of testes from HFD mice, besides the interstitial space and basal compartment, the FITC green fluorescence is also viewed in the lumen of seminiferous tubules (arrows). Scale bars = 100 μm.