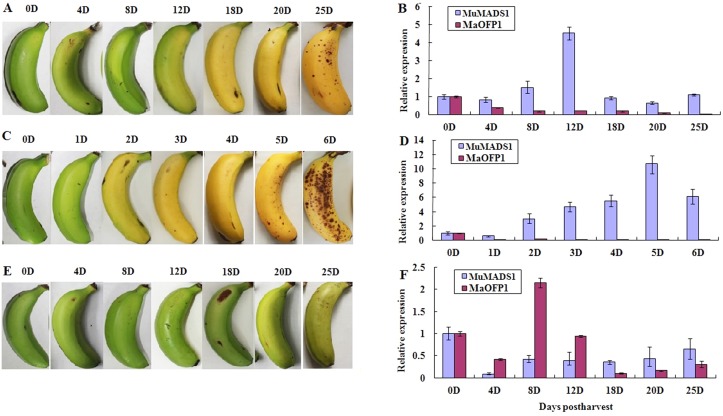
Fig 5. Relative expression of MuMADS1 and MaOFP1 in naturally ripened (A, B), ethylene-treated (C, D), and 1-MCP-treated (E, F) bananas.
The x-axis represents the days postharvest and the y-axis represents relative expression of MuMADS1 and MaOFP1 with respect to actin. Vertical bars on each column indicate SE from three replications. When absent, the bars fall within the dimensions of the symbol.

