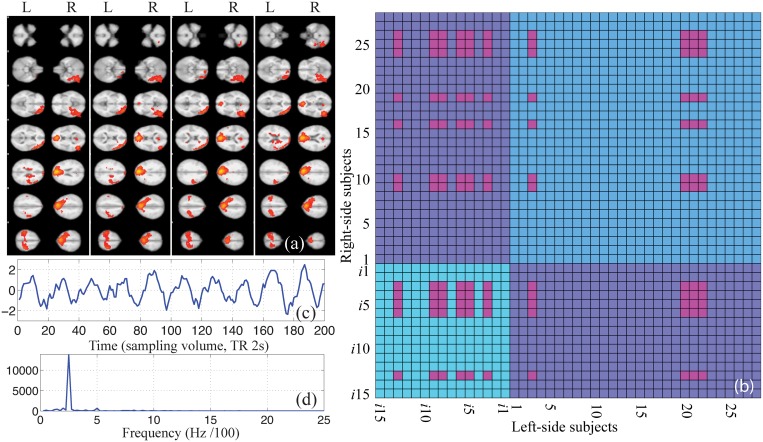
Fig 5. One of the dyadic brain-to-brain coupling modes.
The (a) is one of the independent components derived from the 19 data sets in the task A by group-level ICA. The (b) is the 2D matrix representation of the coupling mode after the IC is projected onto the CCRI. Note that each axis has real and imaginary regions that correspond the exogenous and endogenous labels respectively. All complex numbers and their corresponding labels are listed in the Fig 4e and 4f. Here the vertical axis is for right subjects and the horizontal axis is for left subjects. The (c) and (d) are the temporal course and the frequency response of the synchronized process that represented by this IC.

