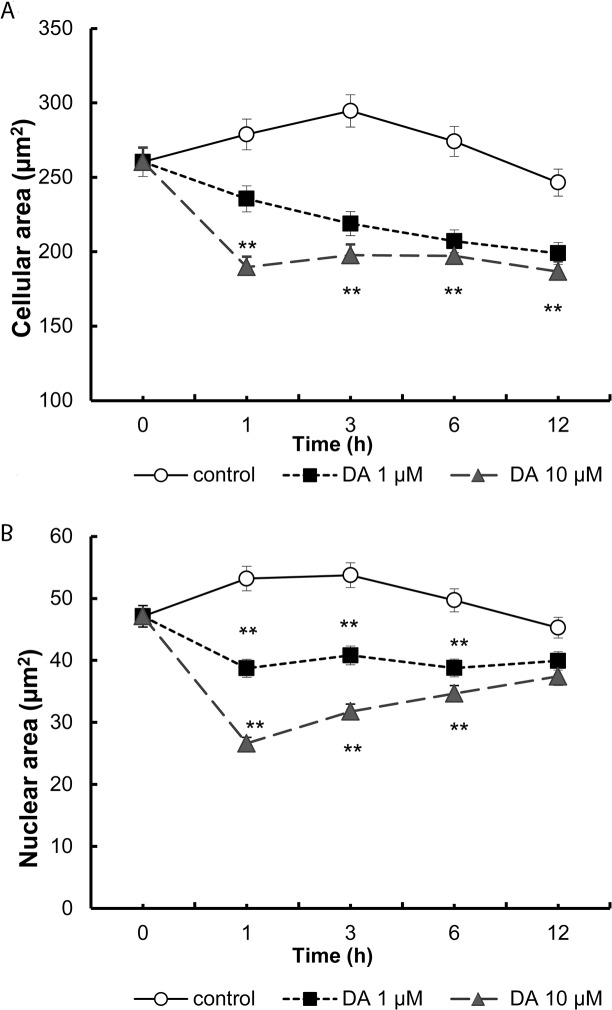
Fig 3. Morphometric effect induced by treatment with dopamine on cellular (A) and nuclear (B) area of beta cells.
Histological sections were selected from micrographs of cross sections of each islets (see methods). In each section the cellular and the nuclear cell profiles from insulin-positive cells were plotted, allowing the surface of the cell and nuclear areas to be calculated after calibration of the Image J application. Cellular and nuclear area from10 islets per study group, and 100cells per islet were measured in 10 mM glucose, 1μM and 10 μM dopamine. (area: μm2, **p<0.01).

