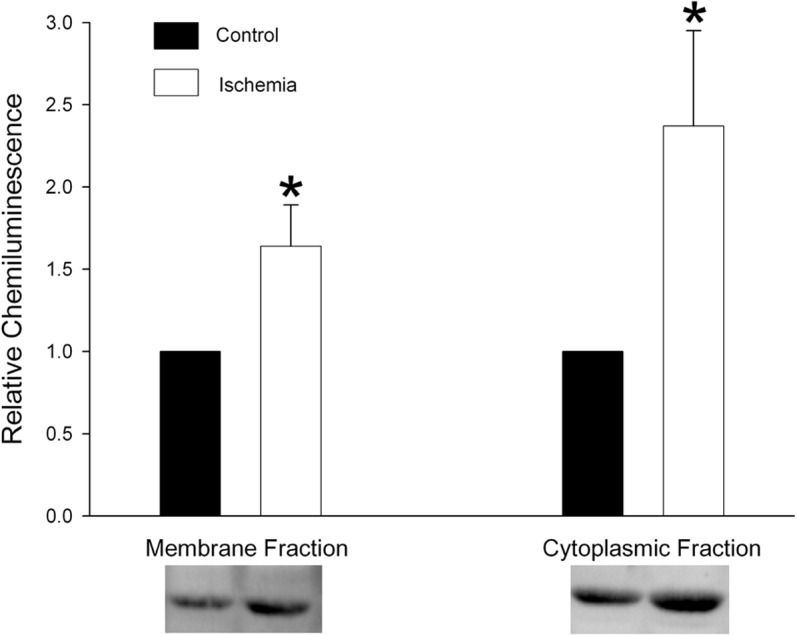
Fig 1. TREK-2 expression is increased in the astrocytic membrane and cytoplasm after ischemia.

Cortical astrocytes in culture were exposed to hypoxic/hypoglycemic conditions for 24 hours and then processed using a cell surface biotinylation assay. The graph displays the quantification of the relative chemiluminescence intensity ± standard error of the mean (SEM) of TREK-2 protein in membrane and cytoplasmic fractions obtained from control astrocytes and astrocytes subjected to ischemia (representative Western blots shown below the graph). TREK-2 was detected as a band of around 60kDa which is consistent with the predicted molecular weight of 59.6kDa. The results of 4 separate experiments using different astrocyte cultures are shown. The asterisks indicate a significant difference from control (t-test; p<0.05). Data are expressed relative to control.
