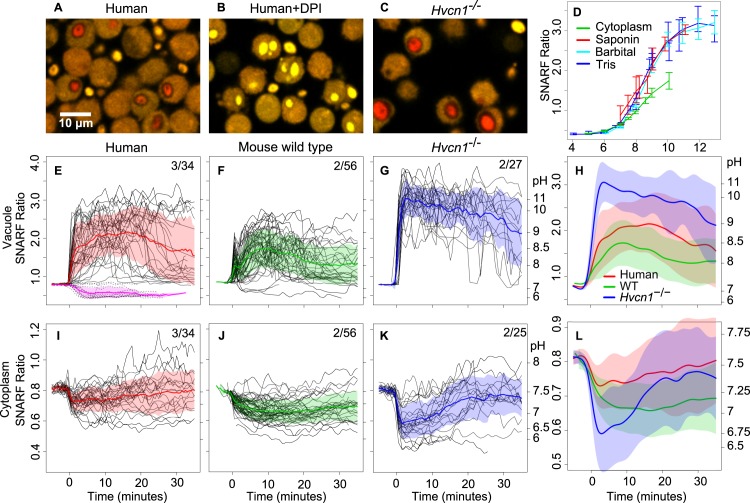
Fig 3. Time courses of changes in pH in the vacuole and cytoplasm of phagocytosing neutrophils.
Representative images of Candida phagocytosed by human neutrophils (A), with DPI (B), and by Hvcn1 -/- neutrophils (C). Standard curves for the relationship between SNARF ratio and pH of organisms and cytoplasm are shown in (D). Candida alone were added to two different buffer systems, labelled Tris or Barbital, and intracellular organisms were exposed to the Barbital buffers after permeabilisation of neutrophils with saponin. Panels E-L show time courses of the pH changes of phagocytosed Candida and cytoplasm of human (E, I), mouse WT (F, J) and Hvcn1 -/- (G, K) neutrophils synchronised to the time of particle uptake (0 minutes). In E-G and I-K, each individual black line represents serial measurements of the SNARF ratio of a single phagocytosed Candida or neutrophil cytoplasm, respectively. Mean ± SD (shaded areas) are shown. In the composite panels H and L the mean data have been smoothed. Data are plotted according to SNARF ratio with the approximate corresponding pH shown on the right y-axis. The number of independent experiments over the total number of individual cells examined is shown. The effect of DPI on vacuolar pH in human neutrophils is shown in E (pink and dashed lines, 12 cells).

