
Fig 2. Plot of the changes in the BMP-2 levels in serum at different post-surgery time points.
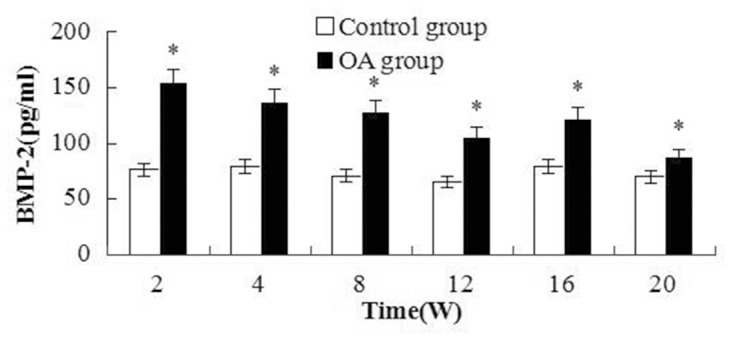
The BMP-2 levels peaked at times W2 and W16. Significant differences were found between the OA and control groups. Asterisks indicate significant differences with paired-samples T tests.