
Fig 6. T2* values were elevated after W2 compared with the control group, but significant differences appeared from W8 to W20.
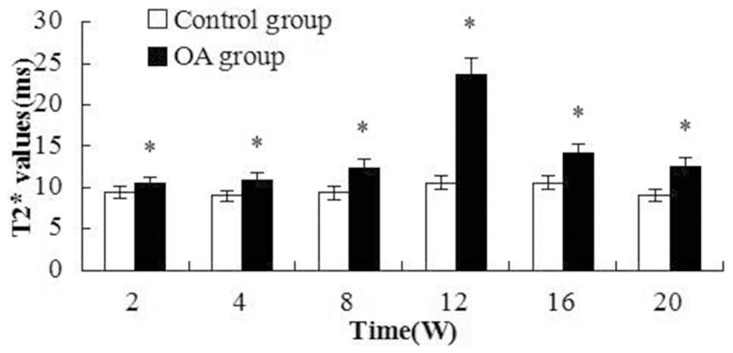
Asterisks indicate significant differences with paired-samples T tests.
Official websites use .gov
A
.gov website belongs to an official
government organization in the United States.
Secure .gov websites use HTTPS
A lock (
) or https:// means you've safely
connected to the .gov website. Share sensitive
information only on official, secure websites.
Asterisks indicate significant differences with paired-samples T tests.