
Fig 7. T2 mapping images (A-F) and T2* mapping (A-F) images of rabbit cartilage at different time points after surgery (W2, W4, W8, W12, W16, and W20).
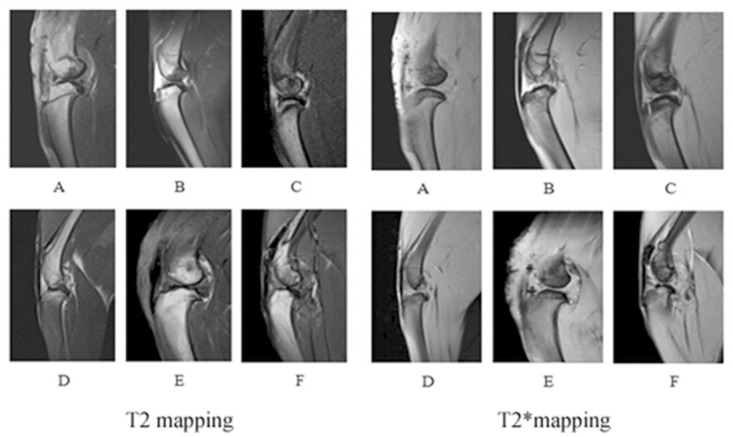
The cartilage was integral and had moderate to slightly high linear homogeneous signal (A-B). The cartilage had moderate to slightly high signal and poor contrast with adjacent synovial fluid, adipose tissue and myeloid tissue(C-D). The cartilage was not integral and had slightly high heterogeneous signal(E-F).