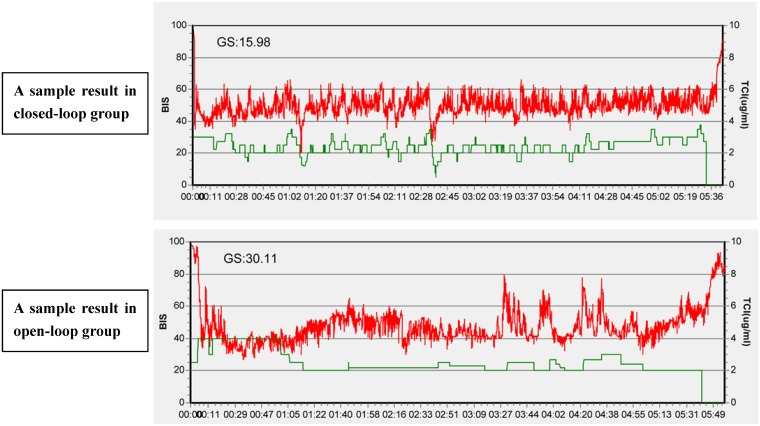
Fig 4. Two samples of the result of the trends of BIS and calculated target concentrations of propofol during anesthesia from the two groups.
Two samples of the result of the trends of BIS (red lines) and calculated target concentrations of propofol (green lines) during the induction phase and maintenance phase in the two groups. The above was the closed-loop group (GS = 15.98) and the below was opened-loop group (GS = 30.11).

