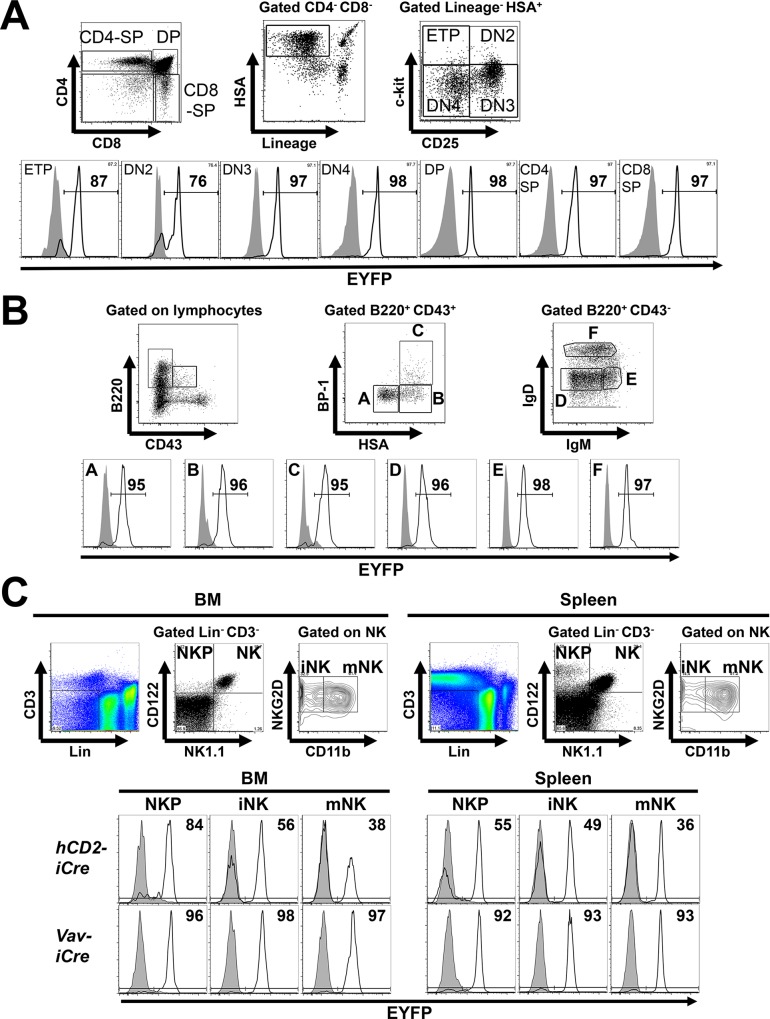
Fig 3. hCD2-iCre activity in T, B and NK cell development.
(A) Thymocyte populations were identified by the gating strategy in the upper panel [13,31–33]. Lower panel, EYFP expression in the indicated thymocyte populations from hCD2-iCre +/- R26-stop-EYFP +/- (open histograms) or R26-stop-EYFP +/- mice (shaded histograms). Numbers denote % EYFP+ cells within the indicated population of hCD2-iCre +/- R26-stop-EYFP +/- mice. Representative of three independent experiments (n = 3). (B) Upper panel, subsets of developing B cells in the BM were distinguished as in [19]. Lower panel, EYFP expression in the indicated BM B cell populations from hCD2-iCre +/- R26-stop-EYFP +/- (open histograms) or R26-stop-EYFP +/- mice (shaded histograms). Numbers denote % EYFP+ cells within the indicated population of hCD2-iCre +/- R26-stop-EYFP +/- mice. Representative of three independent experiments (n = 3). (C) Upper panels, NK cell progenitors (NKP), immature (iNK) and mature (mNK) NK cells were identified using the indicated gating strategy [18,29]. Lower panels, EYFP expression in the indicated BM and splenic NK cell populations from (top, n = 3 per genotype) hCD2-iCre +/- R26-stop-EYFP +/- (open histograms) or R26-stop-EYFP +/- mice (shaded histograms), or (bottom, n = 2 per genotype) from Vav-iCre +/- R26-stop-EYFP +/- (open histograms) or R26-stop-EYFP +/- mice (shaded histograms). Numbers indicate % EYFP+ cells in the respective Cre +/- mice. Representative of three independent experiments with hCD2-iCre transgenic mice, and of two independent experiments with Vav-iCre transgenic mice.

