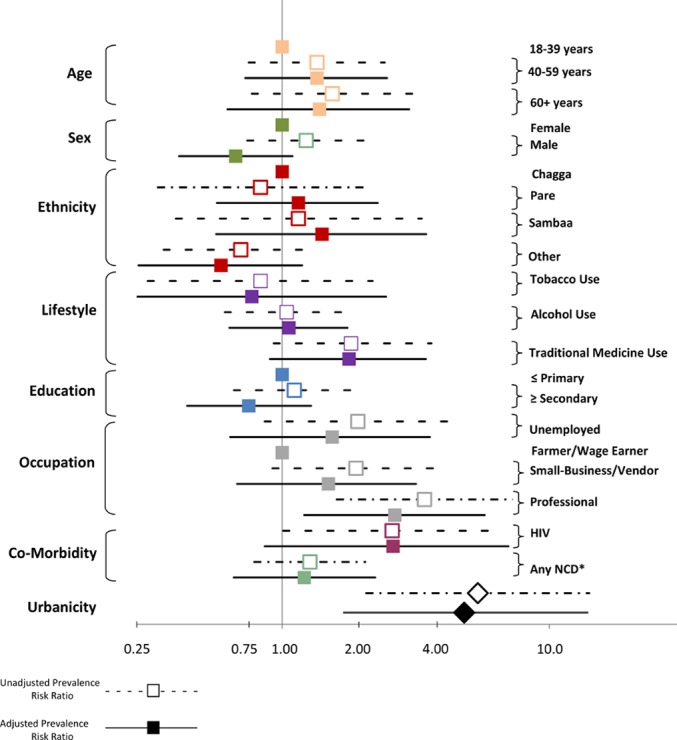
Fig 3. Forest plot.

The crude and fully-adjusted (model 4) prevalence risk ratios for CKD by each variable relative to the reference group for each variable.

The crude and fully-adjusted (model 4) prevalence risk ratios for CKD by each variable relative to the reference group for each variable.