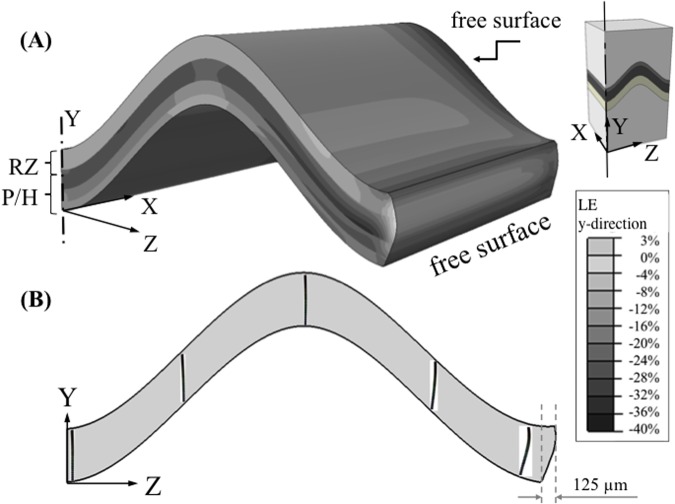
Fig 4. Distribution of the axial logarithmic strain and deformation of the chondrons.
(A) A non-uniform distribution of axial logarithmic strain, in the y-direction, exists within the ‘m’ shape growth plate in the mesoscopic model. Chondrocytes were not included in this model. The distribution of strain was significantly different at these locations from the central or internal regions of the growth plate and reached values approaching double the nominal engineering strain of 20%; (B) Deformed chondrons obtained from the microscale model with cellular detail is overlaid on a deformed macroscale model displaying only the growth plate. Chondrons buckled within 300 μm of free surfaces, but not within the growth plate interior when 20% overall compressive strain was applied across the macroscale model. Deformed models are not scaled up. The ‘m’ shape growth plate exhibited transverse outward buckling deformation of 125 μm at the edge. The contour plot is obtained by extrapolating the integration point values to the nodes and then averaging.

