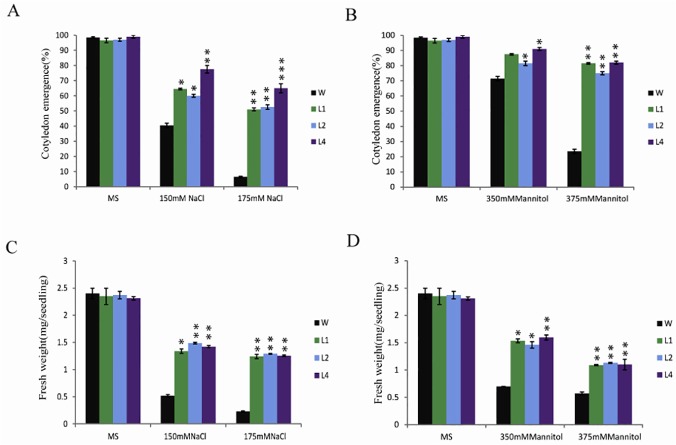
Fig 7. Quantitative analysis of abiotic stress tolerance phenotype.
(A) Cotyledon emergence percentage of WT and OsPP108OX lines L1, L2, L4 on MS (control) media and MS media supplemented with different concentrations of NaCl (150mM and 175mM) and (B) mannitol (350mM and 375mM). Approximately 100 seeds were counted for each genotype. * p-value < 0.05, ** p-value <0.01 and *** p-value < 0.005 shows statistically significant cotyledon emergence for transgenic lines w.r.t WT on different stress media. (C) Fresh weight of 7 days old seedling grown on MS and different NaCl and (D) mannitol concentrations. 15 seedlings of each genotype were recorded and average of three observations is plotted on the graph ± SD. * p-value < 0.05, ** p-value < 0.01 shows statistically significant fresh weight of transgenic lines w.r.t WT on different stress media.

