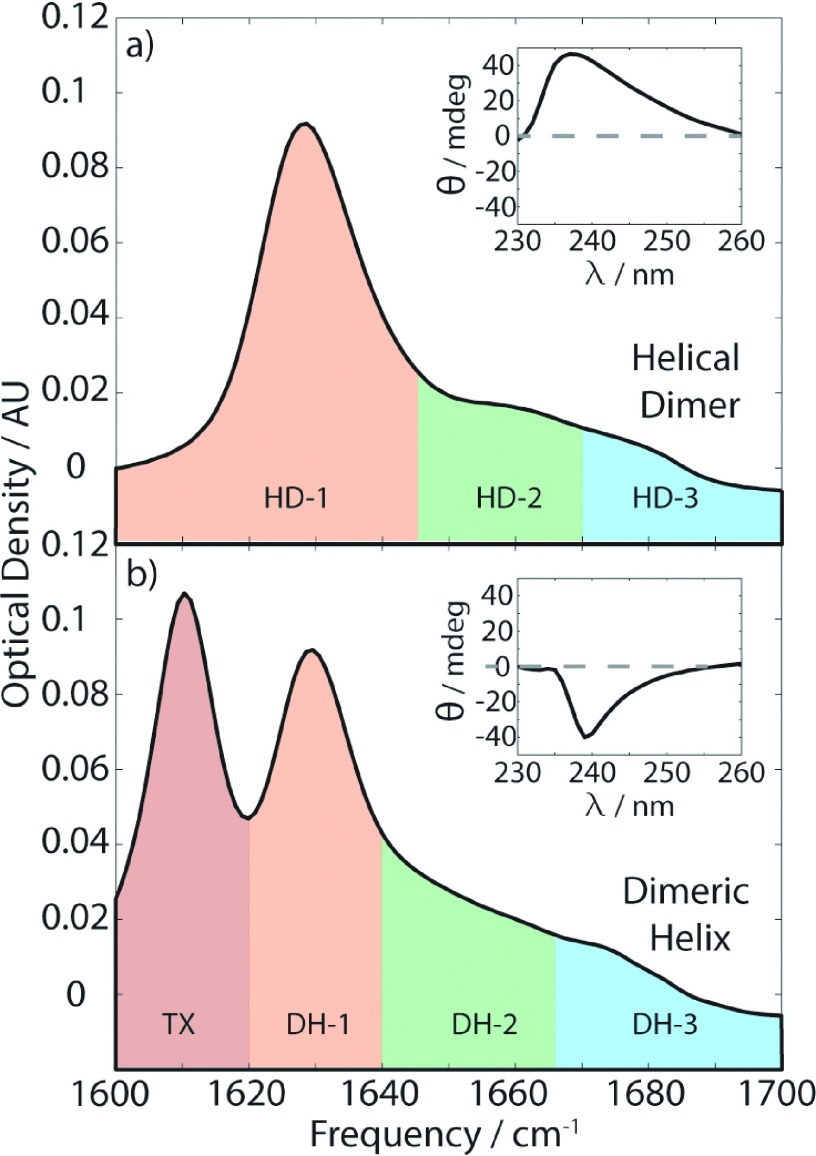
FIG. 2.
Experimental FTIR spectra for the helical dimer form of gramicidin, left, and dimeric helix form, right. Regions referred to in the text have been highlighted in color for clarity here. TX refers to an absorption due to Triton X-100. Insets show the CD spectra, demonstrating the difference in sign of the CD signals.

