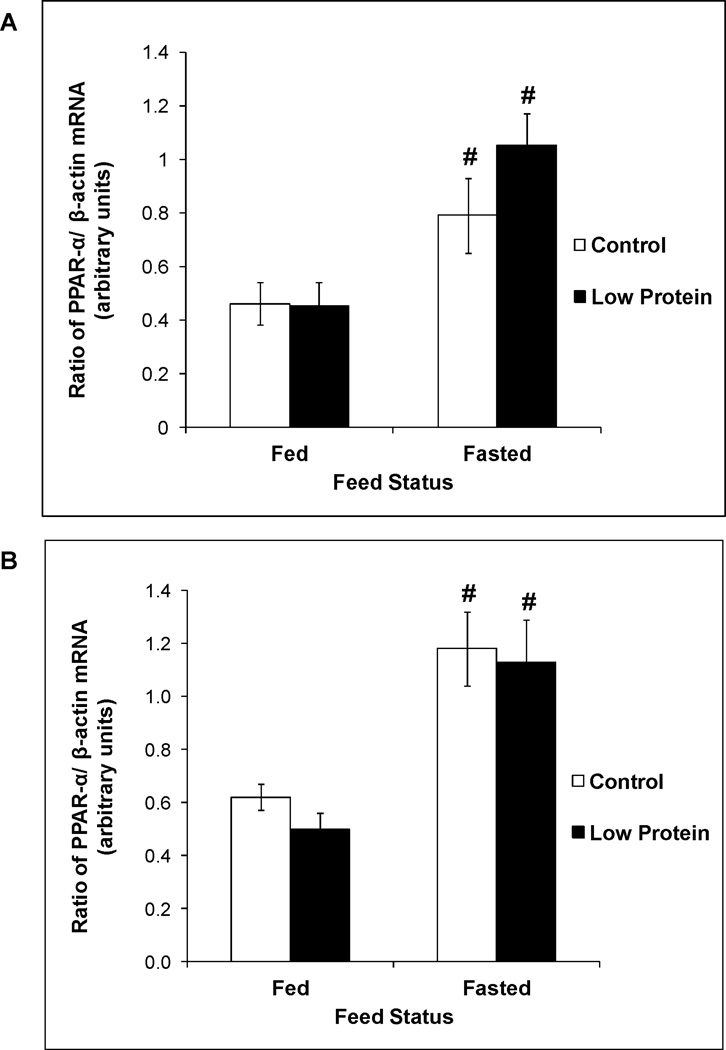
Figure 4.
mRNA expression of PPAR-α in 65 day old control and low protein male offspring in the fed and fasted states. A. Males B. Females.
For details of statistical analyses refer methods and legend of Figure 1. n = 8 – 10.
# P<0.05 compared to activity in the fed state within the same group.

