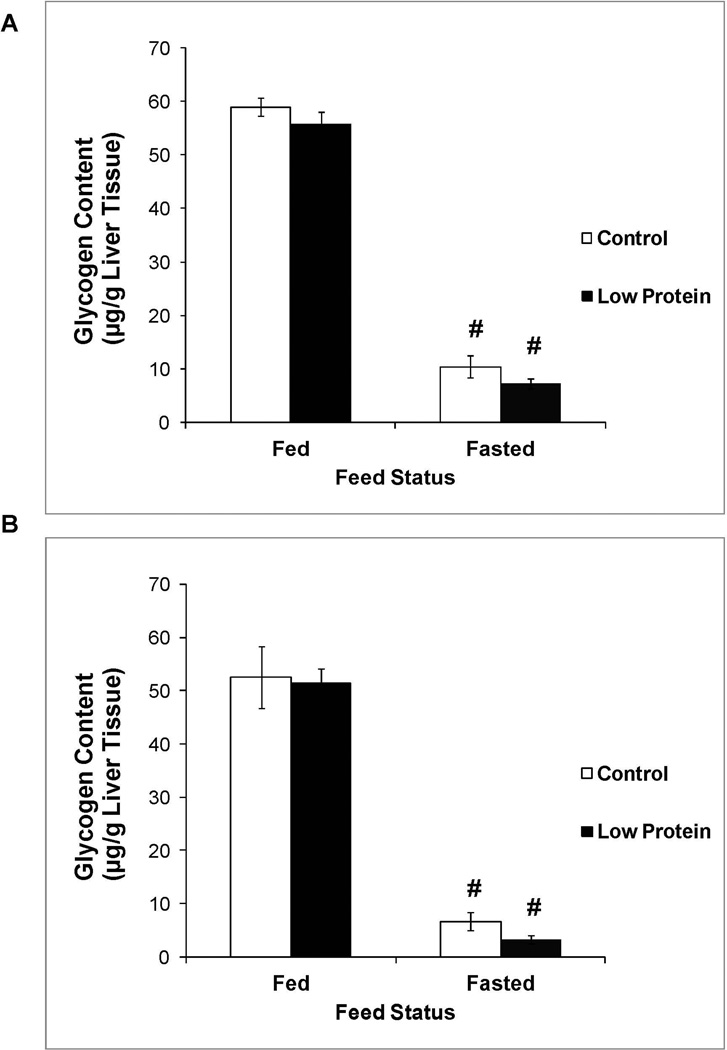
Figure 5.
Liver glycogen content in 65 day old control and low protein offspring in the fed and fasted states. A. Males B. Females.
For details of statistical analyses refer methods and legend of Figure 1. n = 9 – 10.
# P<0.05 compared to liver glycogen content in the fed state within the same group.

