
Fig 2.
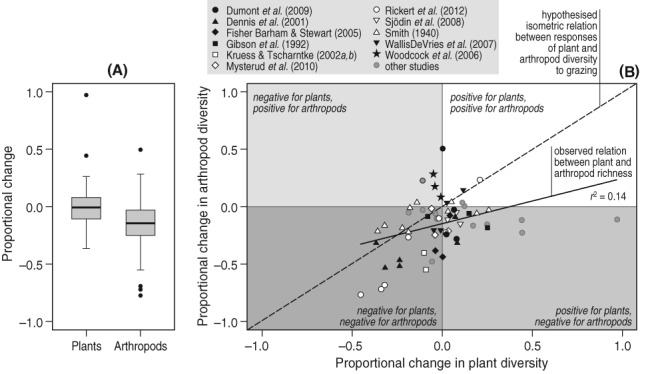
Comparison of the response ratios of plant and arthropod diversity to an increase in grazing intensity (median ± interquartile range, whiskers represent 1.5 × interquartile range, dots represent outliers) (A) and the relationship between these response ratios (B) Data were extracted from 24 studies published between 1940 and 2013 reporting on the effects of grazing on both plant and arthropod diversity, supplemented with data obtained from several authors (see online Table S1).