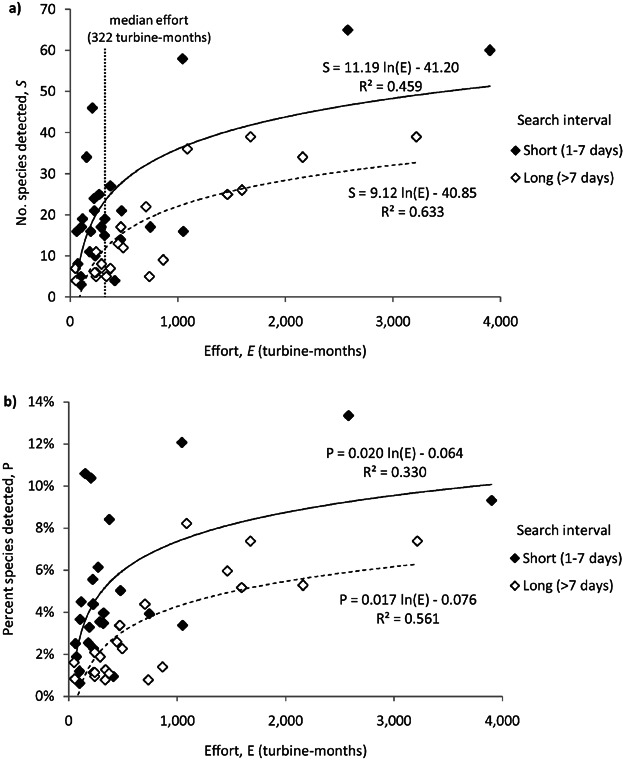
Figure 2.

Number of species (a) and (b) percent of birds occurring in the state detected during fatality monitoring at 50 North American wind facilities sampled between 1995 and 2011 based on sampling interval and the sampling effort (number of turbines multiplied by the duration of study in months). The lines describe the relationships between species and effort for studies with short sampling intervals (solid) and long sampling intervals (dashed).
