
Figure 2.
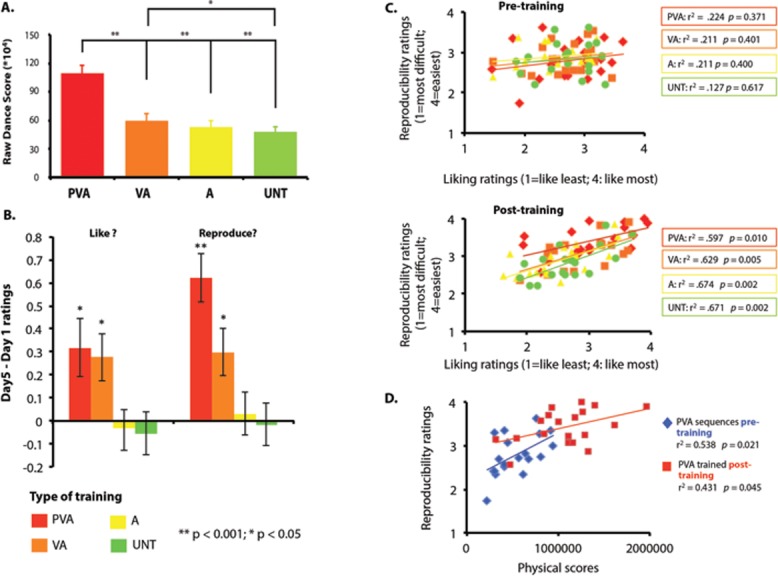
(A) Mean dance scores for all the sequences performed during the dance test on day 5 for each training condition. Significant differences between the PVA and other conditions were found, as well as a difference between the VA and UNT conditions. PVA, physical + visual + audio training; VA, visual + audio training; A, audio-only training; UNT, untrained sequences. **P < 0.001 and *P < 0.05. (B) Differences between pre- and posttraining ratings, for questions concerning liking and reproducibility. *P < 0.05; **P < 0.001. (C) Relationship between reproducibility and liking ratings, pre- and posttraining, for all training conditions. The right-side panel indicates the Pearson correlation factor and P value for each training condition. (D) Relationship between subjective and objective physical scores, illustrated by correlations between reproducibility ratings and physical performance scores pre- and posttraining for PVA sequences. The panel on the right side of the plots specifies the Pearson correlation factor and P value for the PVA training condition pre- and posttraining.