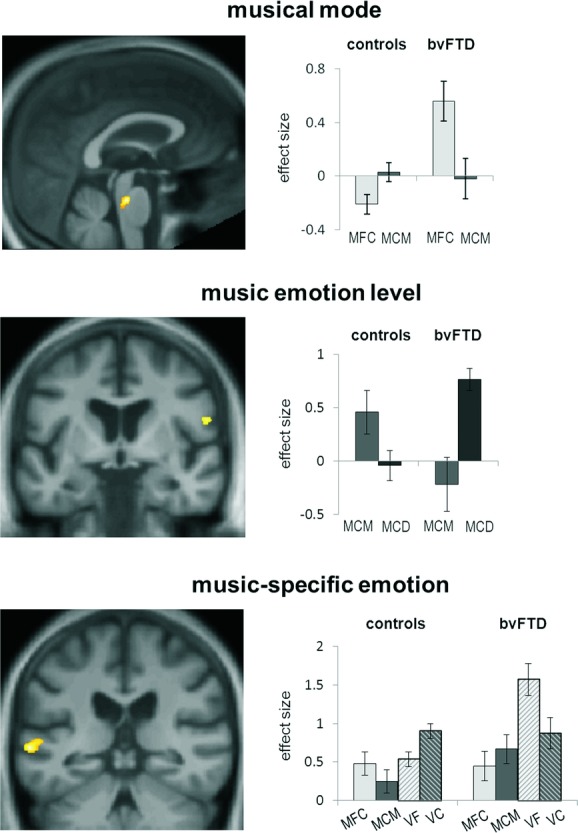
Figure 1.

Statistical parametric maps (SPMs; left panels) of significant between-group contrasts and effect sizes (group mean ± SD peak voxel β parameter estimates; right panels) in key music emotion conditions for behavioral variant frontotemporal dementia (bvFTD) and healthy control groups. SPMs are rendered on a study-specific group anatomical image in MNI space (threshold P < 0.001 uncorrected over whole brain for display; see also Table1). Contrasts were based on interactions as follows: musical mode, ((MCM > MFC) × (controls > bvFTD)); music emotion level, ((MCD > MCM) × (control < bvFTD)); music-specific emotion, ((MCM > MFC) × (VC > VF) × (controls < bvFTD)). MFC, music fixed mode consonant; MCM, music changing mode; MCD, music changing dissonance; VC, vocal changing emotion; VF, vocal fixed emotion.
