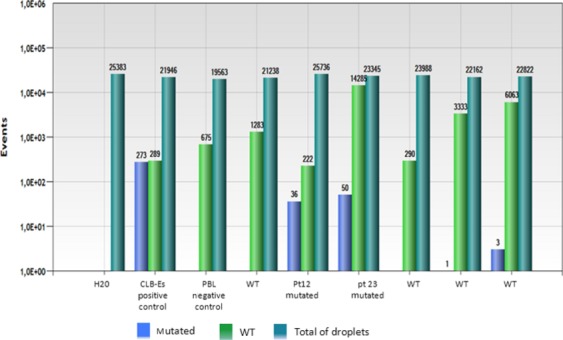
Figure 2.

Representative bar graph of ddPCR analysis of plasma and control samples for identifying the R1275Q ALK mutation (the results of duplicates were merged). The number of droplets positive is indicated at the top of each bar (in blue = droplets containing mutated DNA, in green = droplets containing wild-type DNA). The bar in blue-green define the number of droplets analyzed (empty droplets + droplets containing wild or mutated DNA).
