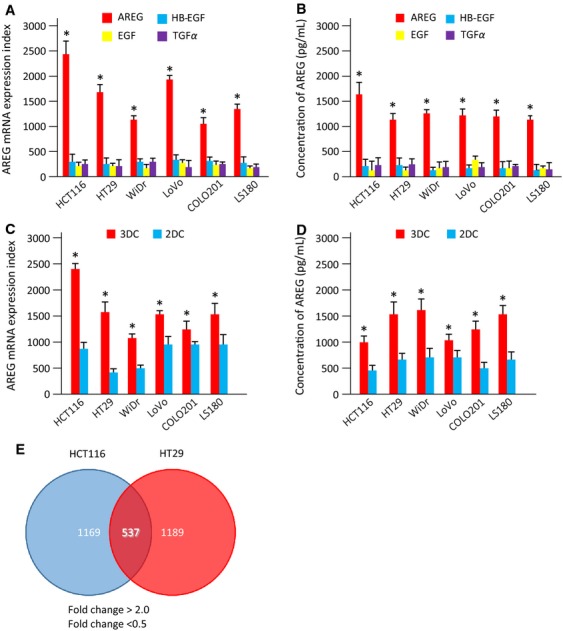
Figure 1.

Screening of genes involved in CRC tumorigenesis. (A) mRNA expression indexes of EGFR ligands in CRC cell lines under three-dimensional culture (3DC). The mRNA expression levels of AREG (red bar), HB-EGF (blue bar), EGF (yellow bar), and TGFα (purple bar) are shown. Data were measured in triplicate and represent mean ± SD. *P < 0.05 versus other EGFR ligands. (B) Levels of soluble EGFR ligands in culture medium under 3DC. Levels of AREG, HB-EGF, EGF, and TGFα proteins per cell were measured by ELISA. Data were measured in triplicate and represent mean ± SD. *P < 0.05 versus other EGFR ligands. (C) Expression of AREG mRNA in CRC cell lines under 3DC or two-dimensional culture (2DC). The mRNA expression levels of AREG were coded as follows: 3DC, red bar; 2DC, blue bar. Data were measured in triplicate and represent mean ± SD. *P < 0.05 versus 2DC. (D) Levels of soluble AREG protein under 2DC or 3DC conditions. The expression levels of AREG protein per cell were measured by ELISA. *P < 0.05 versus 2DC. Data were measured in triplicate and represent mean ± SD. (E) Upregulated (>twofold) and downregulated (<0.5-fold) genes detected by expression microarray analysis. Venn diagrams show the number of common genes in HCT116 and HT29 cells with altered expression in 3DC compared with 2DC. Of these, 537 genes were shared between the two CRC cell lines. The microarray data were obtained from the Gene Expression Omnibus (GEO) database (GEO accession numbers: GSE56738). CRC, colorectal cancer; EGFR, epidermal growth factor receptor; AREG, amphiregulin; HB-EGF, heparin-binding epidermal growth factor-like growth factor; TGFα, transforming growth factor alpha; ELISA, enzyme-linked immunosorbent assay.
