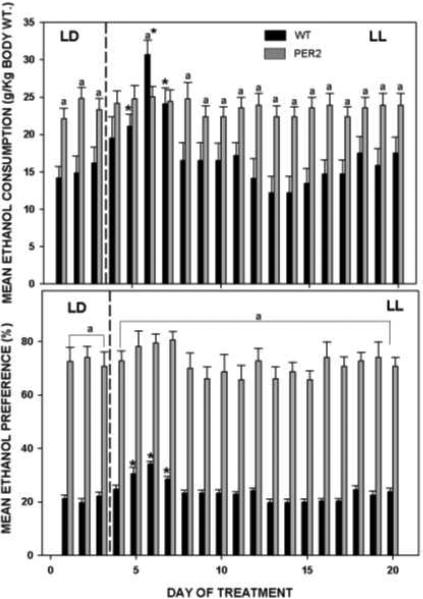
Figure 13.
Free-choice EtOH consumption (top) and preference (bottom) with respect to photocycle (LD; 12L:12D photocycle: LL; constant light). Constant light exposure transiently augments ethanol consumption and preference. Asterisks designate significant difference LL vs. LD (p<0.05); “a” designates significant difference wild-type vs. mPer2 mutant mice (p<0.05). Bars represent means±SEM.

