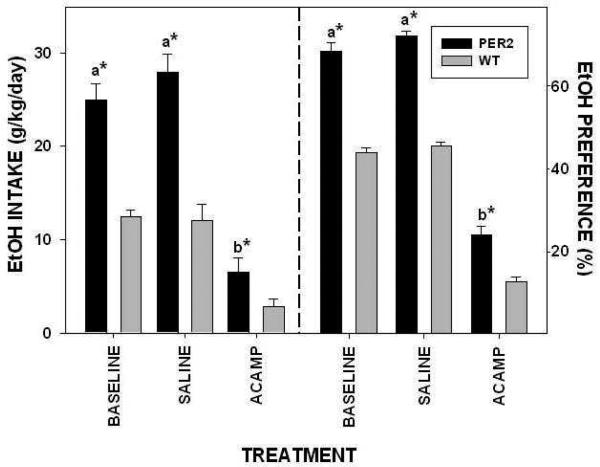
Figure 15.
EtOH intake (left) and preference (right) in mPer2 mutant (PER2) and wild-type (WT) mice during the daily regimen of i.p. acamprosate (ACAMP; 300 mg/kg/day) or saline injection (n=4/group). Bars represent means±SEM. For each parameter, bars with different letters are significantly different (p<0.05). Asterisks denote strain difference (p<0.05).

