
Figure 16.
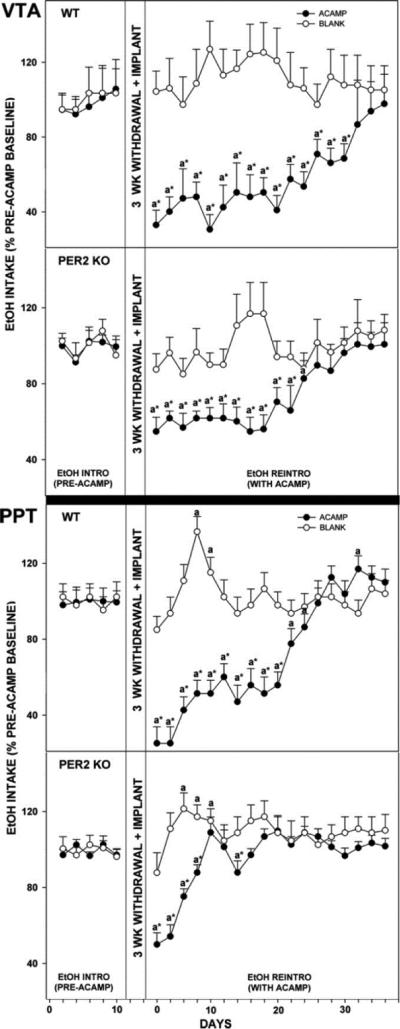
Line graphs show percent change of ethanol intake ± SE from pretreatment levels in mice receiving acamprosate (ACAMP) or no acamprosate (BLANK) from microimplants in reward areas [ventral tegmental area (VTA) andpeduculopontine tegmentum (PPT)during simulated relapse. “a” significant difference from pretreatment levels (p < 0.05). * Significant difference between treatment groups for any given day (p < 0.05). Bar graphs show means ± SEM for the time point of maximal suppression of ethanol intake by acamprosate microimplants in WT vs. mPer2 mutant (PER2 KO) mice. * Significant difference between strains (p < 0.05).