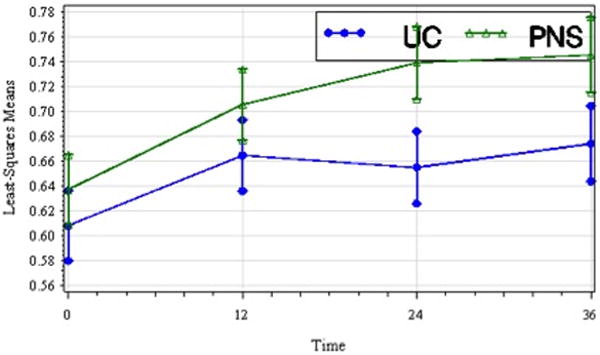
Figure 2.

Least-squares means of stride length (m) by treatment group over time including standard error bars (t1, pretreatment; t2, 12 wks; t3, 24 wks; t4, 36 wks). Stride length improved over time in both treatment groups though the between group difference was not significant.
