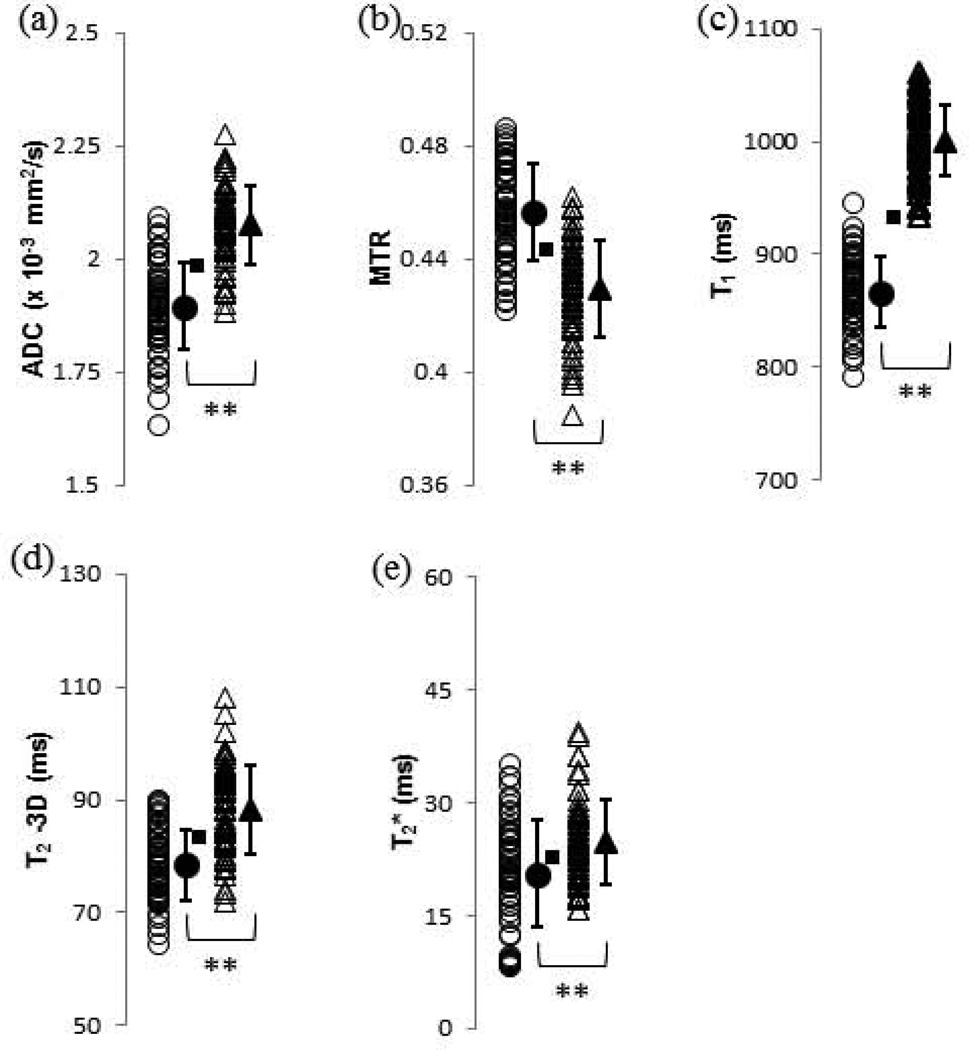
FIGURE 2.
Values of pure MR parameters for control (open circles) and 2.5-h trypsin-degraded (open triangles) BNC samples. Group means and standard deviations are shown as adjacent solid shapes and error bars. The classification boundary based on the Euclidean distance metric is indicated with a square to indicate which samples which would have been misclassified based on the group means of the total set of control (n = 60) and 2.5-h trypsin degraded (n = 60) datasets. The actual classification results were obtained using a cross-validation procedure as described in the text. (a) ADC, with 12 control and 9 degraded misclassified samples; (b) MTR, with 15 control and 12 degraded misclassified samples; (c) T1, with 1 control and 0 degraded misclassified samples; (d) T2 – 3D, with 13 control and 17 degraded misclassified samples; and (e) T2*, with 22 control and 23 degraded misclassified samples. * p < 0.05 control vs. 2.5-h trypsin, ** p < 0.01 control vs. 2.5-h trypsin

